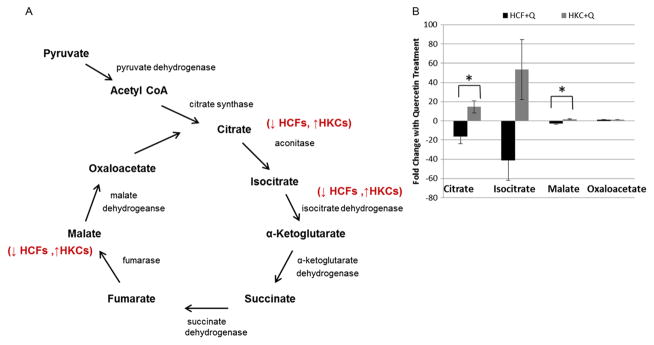
Figure 5.
(A) Schematic of the TCA cycle showing the effect of quercetin in modulating concentrations of key metabolites in HCFs and HKCs. (B) Quantification of fold changes in citrate, isocitrate, malate and oxaloacetate in HCFs and HKCs following quercetin treatment. Statistical significance denoted by * = p <0.05 determined by an unpaired Student T-test. Q = quercetin. Data is representative of three independent experiments, n = 3

