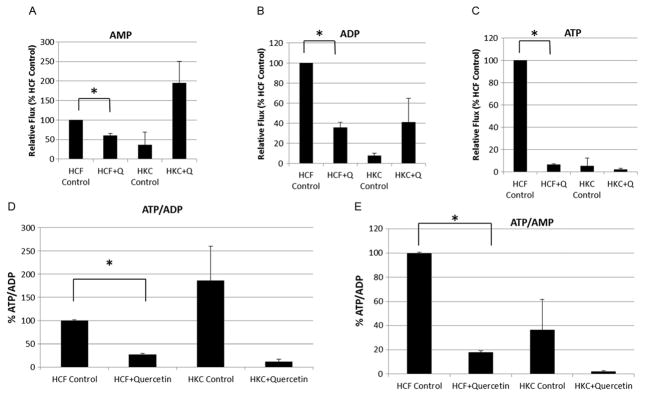
Figure 7.
Relative flux of (A) AMP, (B) ADP and (C) ATP in HCFs and HKCs measured by LC-MS/MS. (D) Ratios of ATP/ADP and (E) ATP/AMP in HCFs and HKCs following quercetin or vehicle (control) treatment, as measured by LC-MS/MS. Values normalized to HCF control. n = 3, error bars represent standard error of the mean. Statistical significance denoted by * = p <0.05 determined by an unpaired Student T-test. Q = quercetin. Data is representative of three independent experiments, n = 3

