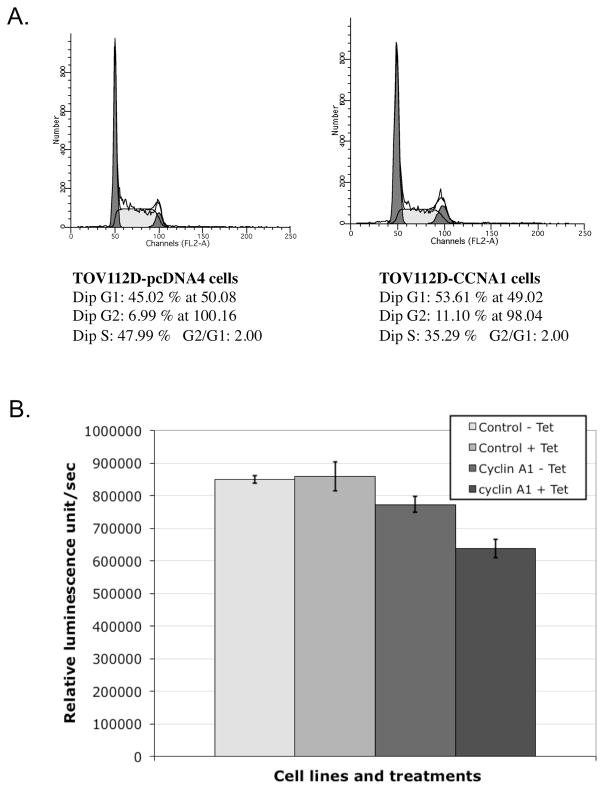
Figure 3. Cell cycle distribution and proliferation of TOV112D-CCNA1 and TOV112D-pcDNA4 control cells.
(A) Cell cycle distribution of the cancer cells analyzed by propidium iodide staining and flow cytometry. Both cell types were analyzed in the presence of tetracycline induction. The percentages of cells in the various cell cycle phases are presented. (B) Proliferation rates of cells as determined by a BrdU chemiluminescence immunoassay kit.

