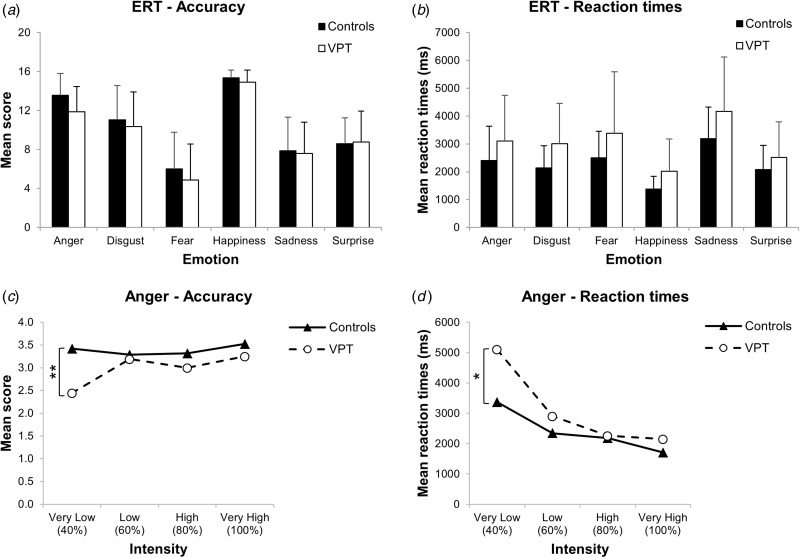
Fig. 1.
Emotion Recognition Task (ERT) performance. (a) Mean scores and (b) mean reaction times of very preterm birth (VPT) participants and controls for the six ERT emotions. Error bars represent 1 standard deviation. (c) Mean scores and (d) mean reaction times of VPT participants (white dots) and controls (black triangles) at the four levels of intensity for anger. *p < 0.05, **p < 0.001.

