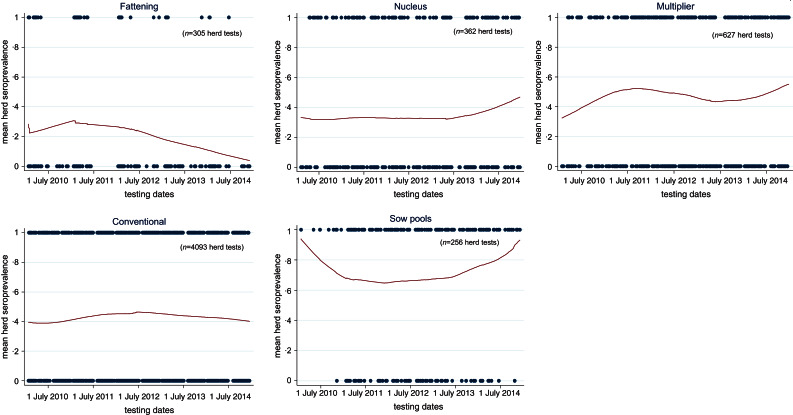
Fig. 5.
Temporal trends* pig herds seroprevalence of influenza A(H1N1)pdm09 virus infection in Norway, stratified by five production classes from 1 January 2010 to 31 December 2014. (* Using Stata's lowess smoothing plots to show running mean between positive herds and negative herds with date as the unit measure for cross-section of proportion of positive herds.)

