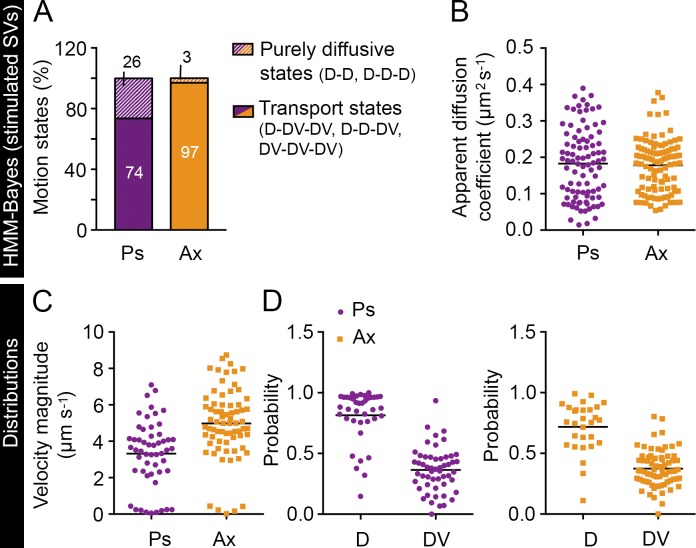
Figure 9.
HMM-Bayes analysis of the restimulation effects on the VAMP2 mobility. (A) Percentage of presynapses (Ps) and axons (Ax) exhibiting purely diffusive motion (D) or a combination of diffusive and transport motion (DV). The apparent diffusion coefficient distributions (B), the velocity magnitude distributions (C), and the probability of remaining in the same state in the next time step from all mobility states (D), including both diffusive and transport states, in axons and presynapses. n = 34 presynapses (7,000 trajectories) and 34 axonal segments (12,300 trajectories) from 15 and 12 hippocampal neurons, respectively, in individual cultures. In B–D, the horizontal line indicates the mean.

