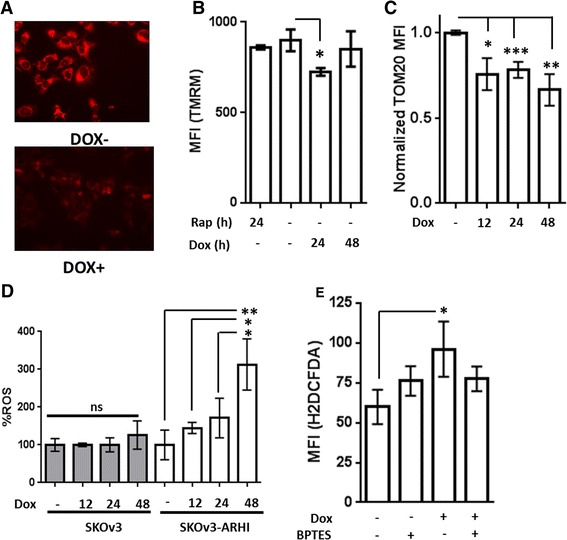
Fig. 6.

ARHI Expression alters Mitochondrial Membrane Potential and ROS in SKOv3-ARHI. a SKOv3-ARHI cells were treated with and without Dox followed by staining with Mitotracker Red FM and visualized by fluorescence microscopy at 24 h. b SKOv3-ARHI cells were treated with Dox or Rapamcyin for the indicated times followed by tetramethyl rhodamine methyl ester (TMRM). The mean fluorescence intensity (MFI) was obtained by flow cytometry. Three replicate samples were used for each condition and the error bars represent the standard deviation. Statistical significance was obtained by two-tailed t-test in GraphPad (*, p < 0.05) c SKOv3-ARHI cells were treated with Dox for 48 h, followed by fixation in 3 % paraformaldehyde and permeabilization with 0.1 % Triton X-100. Cells were then stained with TOM20 antibody (Santa Cruz Biotechnology) and a secondary goat Anti-rabbit IgG conjugated to AF488® and analyzed by flow cytometry. Eight replicates from two independent experiments were normalized to the MFI obtained in the Dox- controls and analyzed in GraphPad. The error bars represent the standard error and statistical significance was obtained by a two-tailed t-test (*, p < 0.05; **, p < 0.01; ***, p < 0.001). d SKOv3 (parental) and SKOv3-ARHI cells were treated with Dox for the indicated times followed by H2DCFDA and analyzed by flow cytometry. The resulting MFI values were normalized to the Dox- value in either the parental or ARHI-transfected cell line. e SKOv3-ARHI cells were treated with Dox for 48 h with and without BPTES (1 uM) followed by staining with H2DCFDA and analysis by flow cytometry. Each experimental condition in d) and e) was carried out in triplicate and the mean fluorescence intensity plotted above along with the standard deviation. The statistical significance was determined by unpaired, two-tailed t-test in GraphPad (*, p < 0.05; **, p < 0.01)
