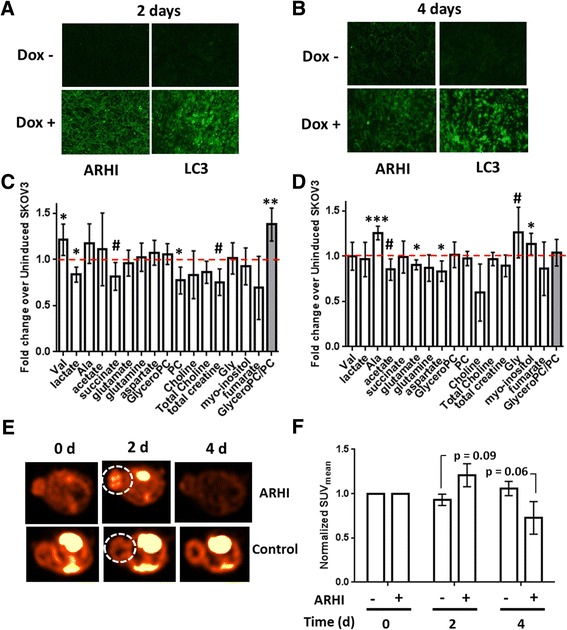
Fig. 7.

In vivo Metabolomics of SKOv3-ARHI. Tumors obtained from mice treated with doxycycline and sucrose (Dox+) or sucrose alone (Dox-) for 2 days (a) or 4 days (b) were sectioned and stained with fluorescent anti-ARHI and anti-LC3 antibodies (green). Tumors at 2 days (c) or 4 days (d) following treatment were homogenized and extracted to yield the water-soluble metabolites which were analyzed by 1H-NMR. After normalizing each metabolite to the total 1H-NMR signal, the fold-change ratio was calculated to determine the relative change in each metabolite after ARHI induction relative to non-induced tumors (dotted red line). The mean fold-change between induced (n = 4) and non-induced (n = 4) tumors at each time point is plotted along with the standard deviation. Statistical significance was determined by unpaired two-tailed t-test in Graphpad (#, 0.1 > p > 0.05; *, p < 0.05; ***, p < 0.001). e Subcutaneous SKOv3-ARHI were injected with [18F]-FDG and imaged by PET/CT at 0, 2, and 4 days following induction of ARHI. Axial slices from a representative ARHI-induced (n = 4) or control (n = 5) mouse in each group are shown for each of the time points. The tumor is circled (white dotted line). f The mean standard uptake value (SUVmean) in each tumor was determined as a function of time and normalized to the SUVmean at time = 0. The normalized values were plotted along with the standard error of the mean. Statistical significance between induced and control groups at 2 days and 4 days was determined by two-way ANOVA with p-values adjusted for multiple comparisons
