Fig. 2.

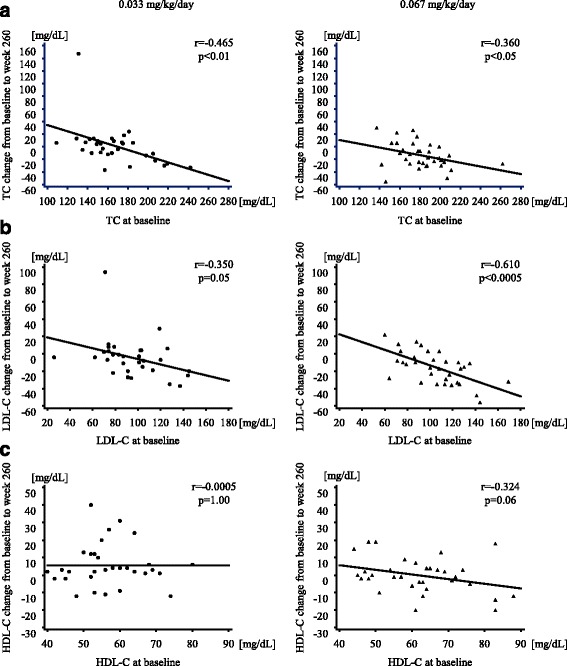
Scatter plots of (a) TC, (b) LDL-C, and (c) HDL-C values at baseline, and changes from baseline to week 260. TC, total cholesterol; LDL-C, low-density lipoprotein cholesterol; HDL-C, high-density lipoprotein cholesterol

Scatter plots of (a) TC, (b) LDL-C, and (c) HDL-C values at baseline, and changes from baseline to week 260. TC, total cholesterol; LDL-C, low-density lipoprotein cholesterol; HDL-C, high-density lipoprotein cholesterol