
Fig. 3.
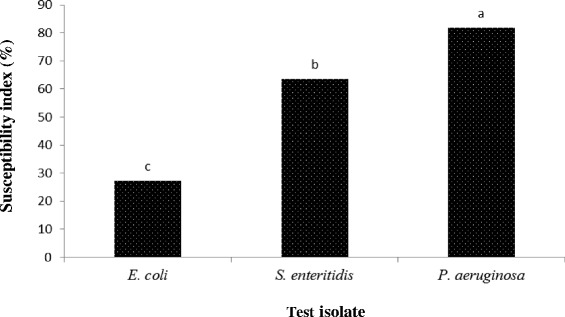
Bacteria susceptibility index (%). Mean values for three replicates are shown. Different letters above the bars indicate significant differences according to the Student Newman-Keuls multiple-range test (0.05)
Official websites use .gov
A
.gov website belongs to an official
government organization in the United States.
Secure .gov websites use HTTPS
A lock (
) or https:// means you've safely
connected to the .gov website. Share sensitive
information only on official, secure websites.
Bacteria susceptibility index (%). Mean values for three replicates are shown. Different letters above the bars indicate significant differences according to the Student Newman-Keuls multiple-range test (0.05)