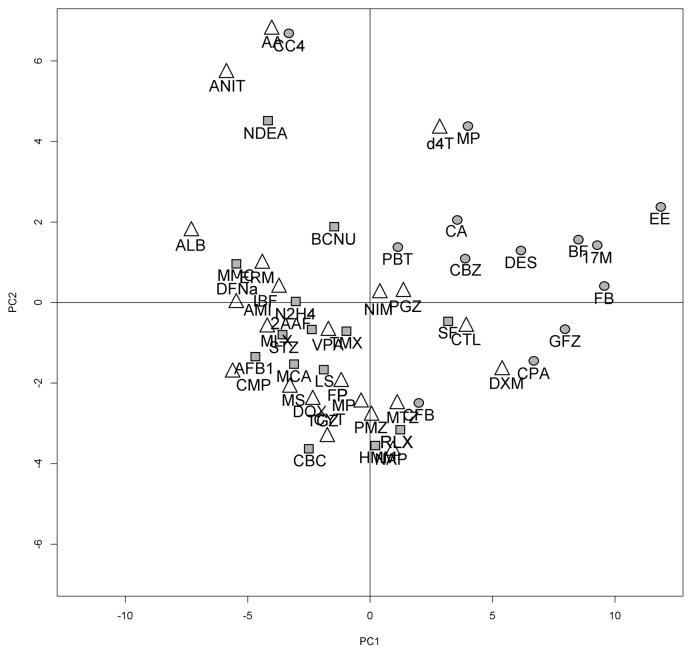
Fig. 2.
Principal Component Analysis (PCA) performed with the 54 selected genes on the DrugMatrix set. Each compound was averaged among replicates. Shapes indicate their class: circles correspond to non-genotoxic carcinogens, squares to genotoxins and triangles to non-hepatocarcinogens. Note that non-genotoxic carcinogens (circles) clustered at the right of PC1, with the exception of CC4.

