Fig. 3a.

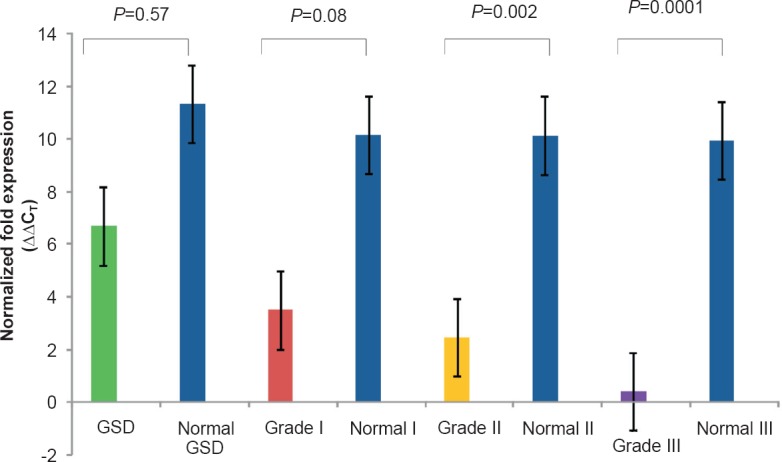
Real-time PCR analysis showing normalized relative fold expression, ΔΔCT of APC exon 1 in GSD and different GBC grades as compared to their respective adjacent normal tissues.

Real-time PCR analysis showing normalized relative fold expression, ΔΔCT of APC exon 1 in GSD and different GBC grades as compared to their respective adjacent normal tissues.