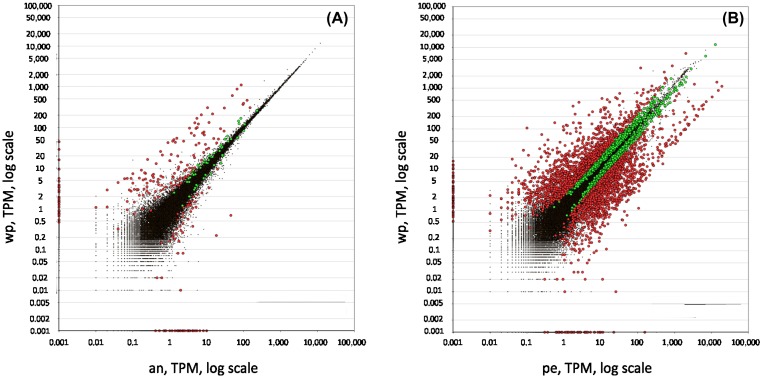
Figure 2.
Distribution of expression values between (A) the whole polyp vs the anterior part and (B) the whole polyp vs the peduncle. Red dots symbolise transcripts with fold change equal or higher than 2, green dots represent fold change equal or smaller than 2, and black dots symbolise transcripts not passing the threshold of 0.95 for the estimated posterior probability of differential expression. wp: whole polyp, an=anterior part, pe=peduncle.

