Figure 2.
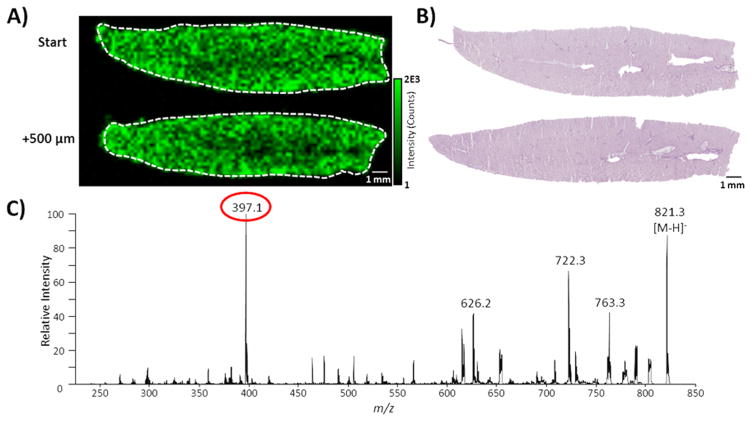
(A) Mass spectrometry image analyzed at a spatial resolution of 200 μm of the primary RIF fragment at m/z 397 and (B) H&E serial section stains of two 12 μm thick sections with 500 μm of the tissue discarded between them of a liver dosed in vitro with RIF. The image of the RIF fragment depicts the homogeneity of the dosing. (C) Average MS/MS spectrum from the dosed tissues with the primary fragment ion m/z 397 circled in red.

