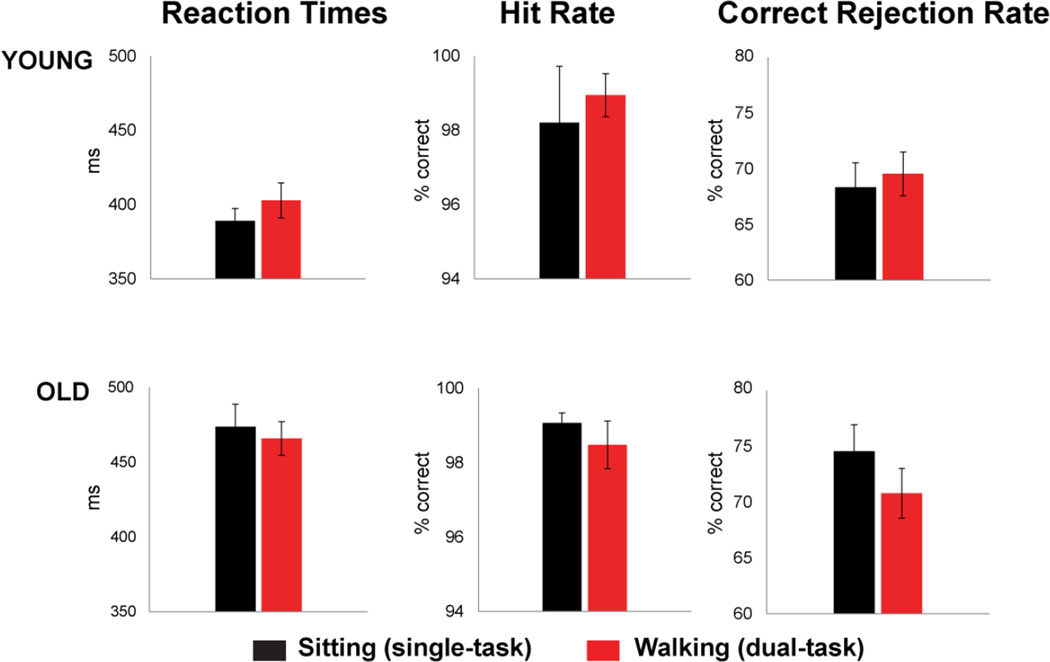
Figure 1.
Behavioral performance on the Go/No-Go task for young (top row) and older participants (bottom row). Reaction times on Go trials, percentage of correct responses on Go trials (hit rate) and percentage of correct rejections (CR rate) on No-Go trials are shown in black for sitting (single-task load) and red for walking (dual-task load) conditions.

