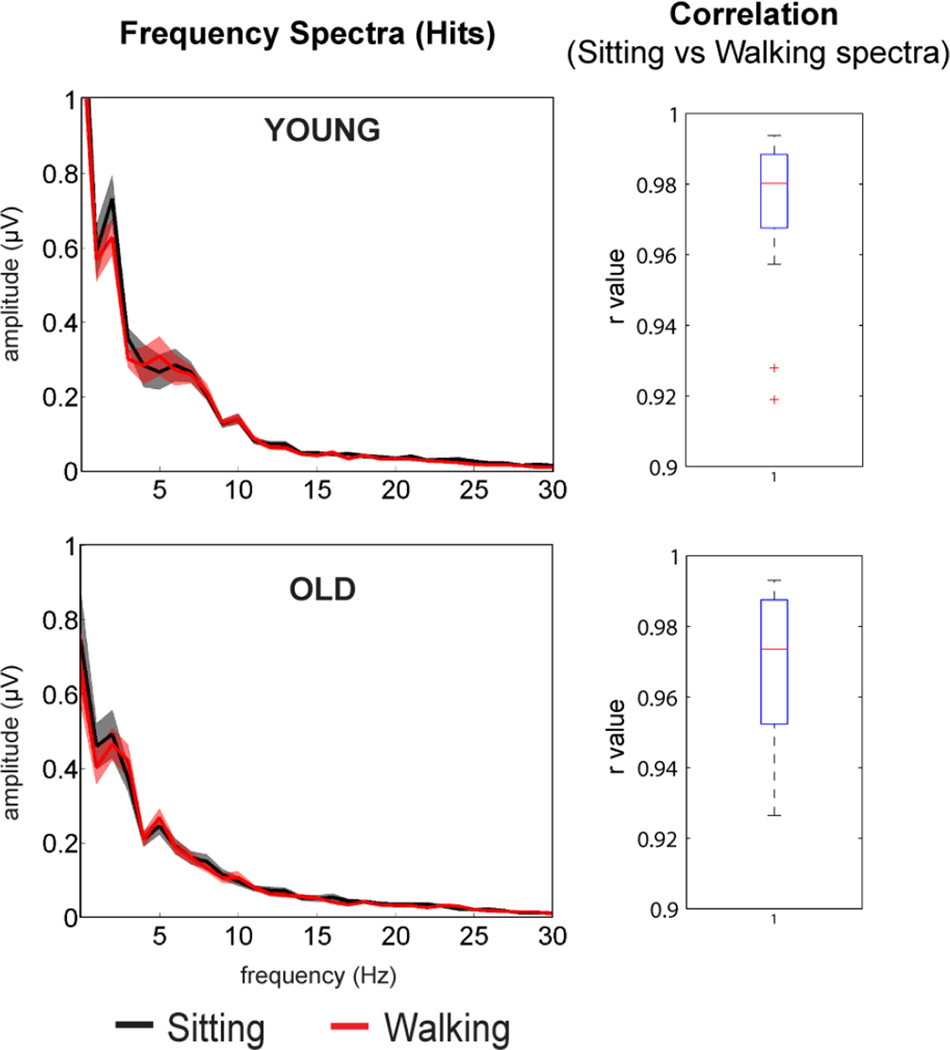
Figure 3.
Grand mean and standard deviation (shading) of frequency spectra averaged across hit trials over central scalp regions (left panel). Sitting condition is presented in black, walking red. The right panel depicts box plots of Pearson’s correlation coefficients of the spectra between sitting vs. walking conditions.

