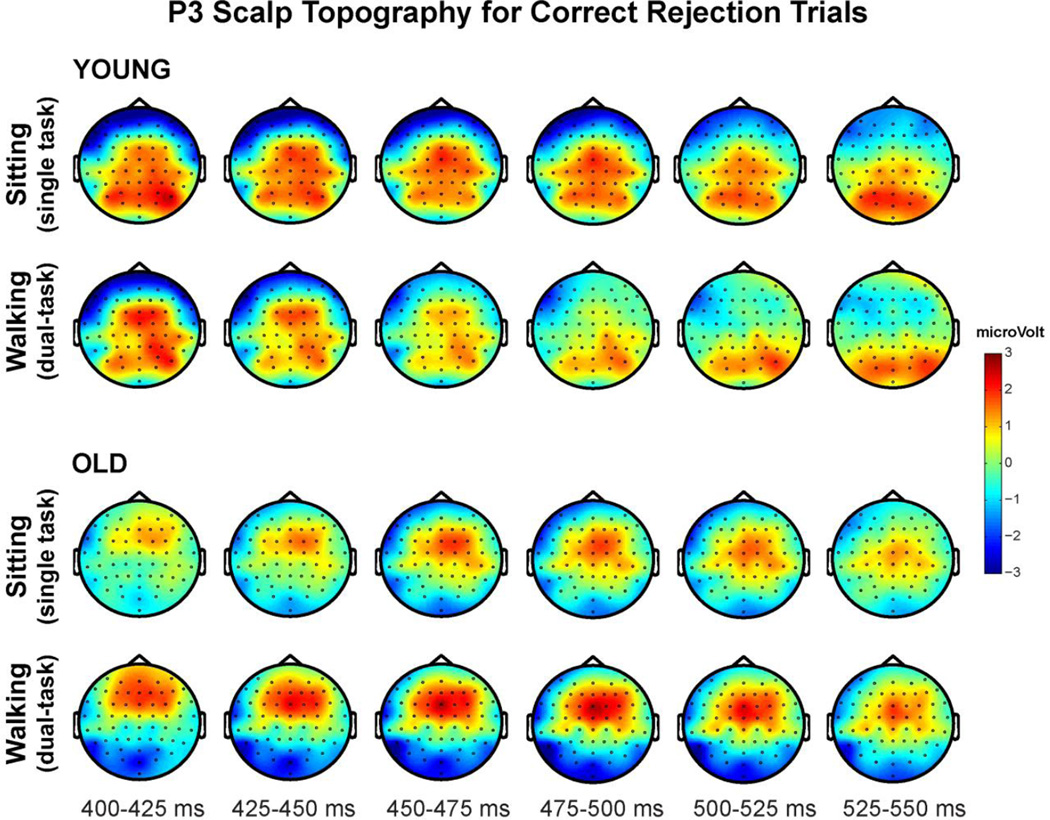
Figure 6.
Topographical distribution of ERP voltage activity across the scalp encompassing the P3 time window (400–550ms) during correct response inhibition trials for young adults (top panel) and old adults (bottom panel). Sitting (single-task) and walking (dual-task) conditions are each depicted averaged across 25ms time intervals.

