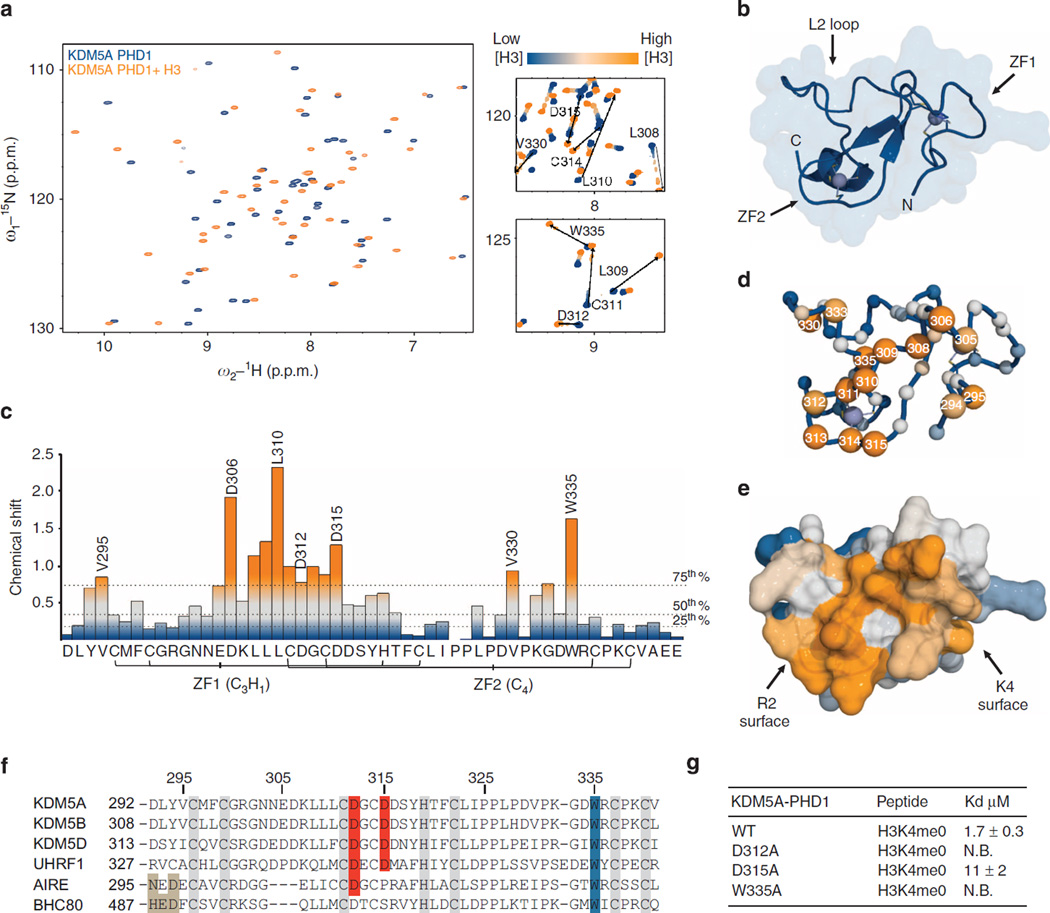
Figure 2. Structure and H3 binding properties of KDM5A PHD1.
(a) Backbone regions of the HSQC spectra of the apo and H3-bound forms of KDM5A PHD1. The apo and H3-bound spectra are coloured blue and orange, respectively. Insets show titration across key structural regions. (b) CS-Rosetta model of the apo KDM5A PHD1, consistent with the lowest energy and dihedral restraint considerations. (c) Normalized change in chemical shift (Hn, N, Hα, Cα and Cβ) by residue on H3 binding. Dashed lines indicate 25th, 50th and 75th percentile rankings, and colour gradient is such that unperturbed (<25th percentile) positions are in blue and significantly perturbed (>75th percentile) are in orange. (d) CS-Rosetta model of KDM5A PHD1 with backbone amides drawn as spheres, coloured by chemical shift perturbation. Selected residue numbers are indicated. (e) Surface representation of the KDM5A PHD1 coloured by chemical shift perturbations reveals the H3 binding surface. (f) Sequence alignment of KDM5A PHD1 to close homologues. Zinc coordinating residues are highlighted in grey, the conserved tryptophan in blue and aspartate residues proposed to coordinate H3R2 are highlighted in red. The residues that interact with H3K4 are highlighted in light brown. (g) Effect of mutations on KDM5A PHD1 recognition of unmodified H3 peptide (NB= no binding, KD>100 µM. Errors (n ≥ 3) represent s.e.m.).

