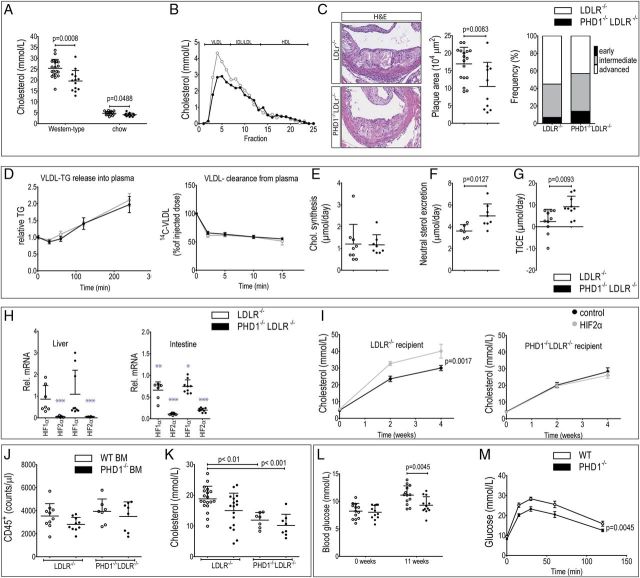
Figure 1.
(A) Total plasma cholesterol levels in LDLR−/− (n=20) and PHD1−/−LDLR−/− mice (n=13) on western-type diet and on normal chow (n=20 per genotype). (B) Lipoprotein fractioning of plasma pools of n=13 PHD1−/−LDLR−/− and n=20 LDLR−/− mice on western-type diet. (C) Representative pictures and quantification of atherosclerotic plaque area, necrotic core and plaque stage frequency per genotype in n=17 LDLR−/− and n=13 PHD1−/−LDLR−/− mice. (D) VLDL-TG release from liver and VLDL-cholesteryl-ester clearance from plasma over time (n=10 per genotype). (E) Cholesterol synthesis upon 13-C acetate administration in drinking water (separate study, n=10 per genotype). (F) Neutral sterol excretion measured in faeces of PHD1−/−LDLR−/− (n=8) and control mice (n=6). (G) Trans-intestinal cholesterol excretion assessed upon whole body cholesterol flux analysis in n=10 mice per genotype. Messenger RNA knockdown efficiency in liver and intestines of LDLR−/− (n = 16 ctrl ASO, n = 7 HIF-2α ASO) and PHD1−/−LDLR−/− (n = 9 ctrl ASO, n = 10 HIF-2α ASO) mice receiving control or HIF2α targeting ASO combined with Western-type diet twice weekly. Data is presented relative to HIF1α and HIF2α expression respectively in LDLR−/− mice receiving control ASO injections (***p < 0.0001, **p = 0.0013, *p = 0.0394). J Plasma cholesterol levels after ASO treatment. Homogeneity of variances was first tested and confirmed using Levene's (IBM SPSS statistics 22). Subsequently, variables were analysed using repeated measured (mixed model) ANOVA, followed by Bonferroni post-test. (J) Blood leukocyte count and (K) plasma cholesterol levels upon PHD1−/− or WT bone marrow transplantation into LDLR−/− (n=17/19, respectively) or PHD1−/−LDLR−/− recipient mice (n=8/7, respectively), analysed using one-way ANOVA followed by Bonferroni's multiple comparison test. (L) Fasting blood glucose levels and (M) glucose tolerance test in PHD1−/− and WT controls (n=13 per genotype). For the glucose tolerance test, area under the curve was calculated with subsequent normal distribution testing using Shapiro–Wilk, followed by the Student's t-test.

