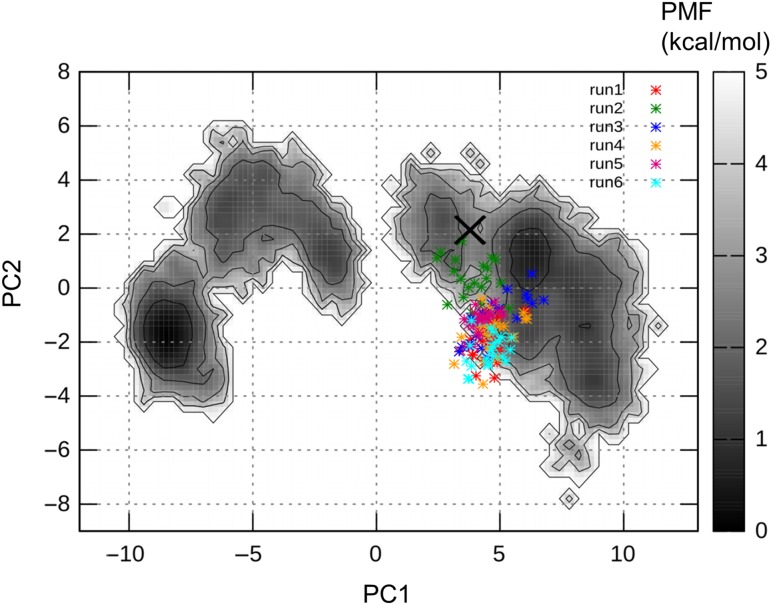
Fig. 3.
Canonical MD trajectories starting from the X-ray crystal structure, projected on the free energy landscape at 300 K. Each trajectory from 40 to 50 ns was used for the projection. Six trajectories are shown in different colors in the figure. The initial crystal structure is shown as the cross. The PMF is shown by the gray color in the contour bar.

