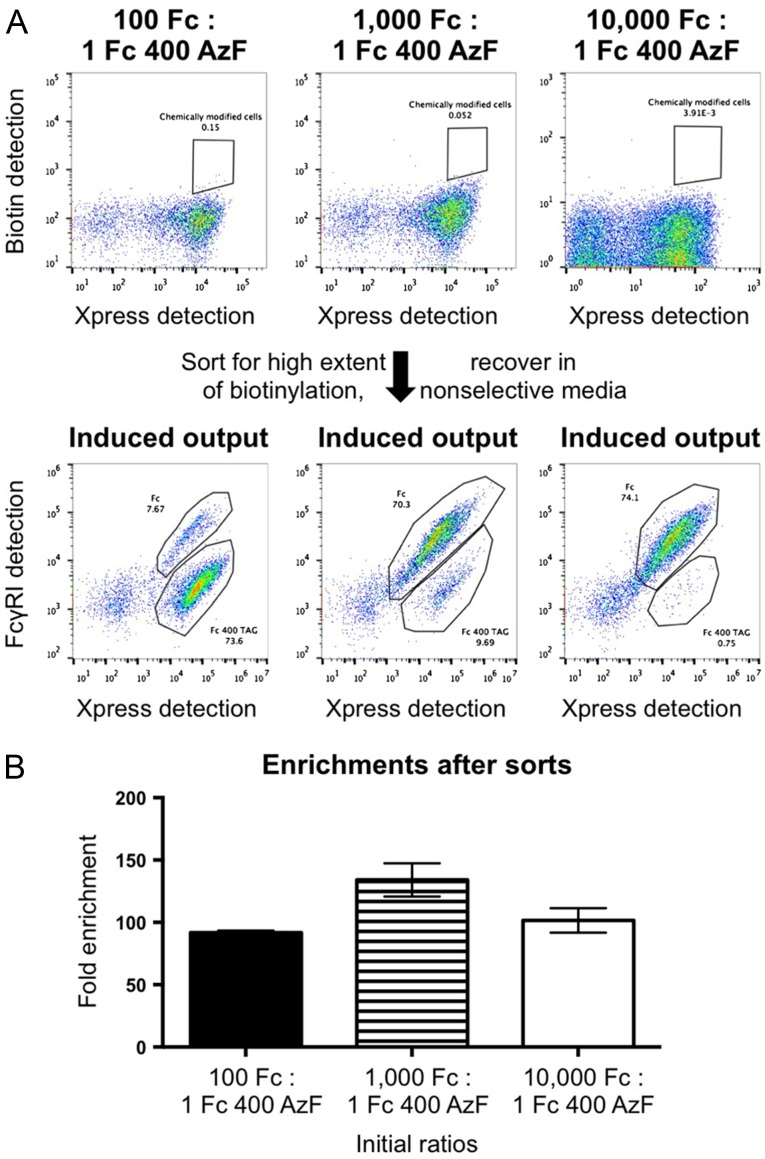
Fig. 4.
Fluorescence-activated cell sorting of yeast-displayed bioconjugates. (A) Representative flow cytometry plots before and after sorting. Mixtures of yeast displaying wild-type Fcs and yeast displaying Fc 400 AzF were subjected to CuAAC with 3, labeled for biotin detection, and sorted. Enriched populations were recovered in media containing leucine, which resulted in retention of only the encoded display constructs, in order to avoid growth biases from the suppression plasmid. After outgrowth, populations were induced and labeled with FcγRI in order to distinguish between full-length Fc constructs (indicated by ‘Fc’) and truncated Fc constructs (indicated by ‘Fc 400 TAG’). Differences in flow cytometry plot appearances are from the use of different instruments on different days. (B) Enrichment factors from sorts. Fold enrichments were calculated by dividing the observed fraction of truncated Fcs by the initial ratio of Fc to Fc 400 AzF. Values reported here are the results of three or more independent sorting experiments at the indicated initial ratios.

