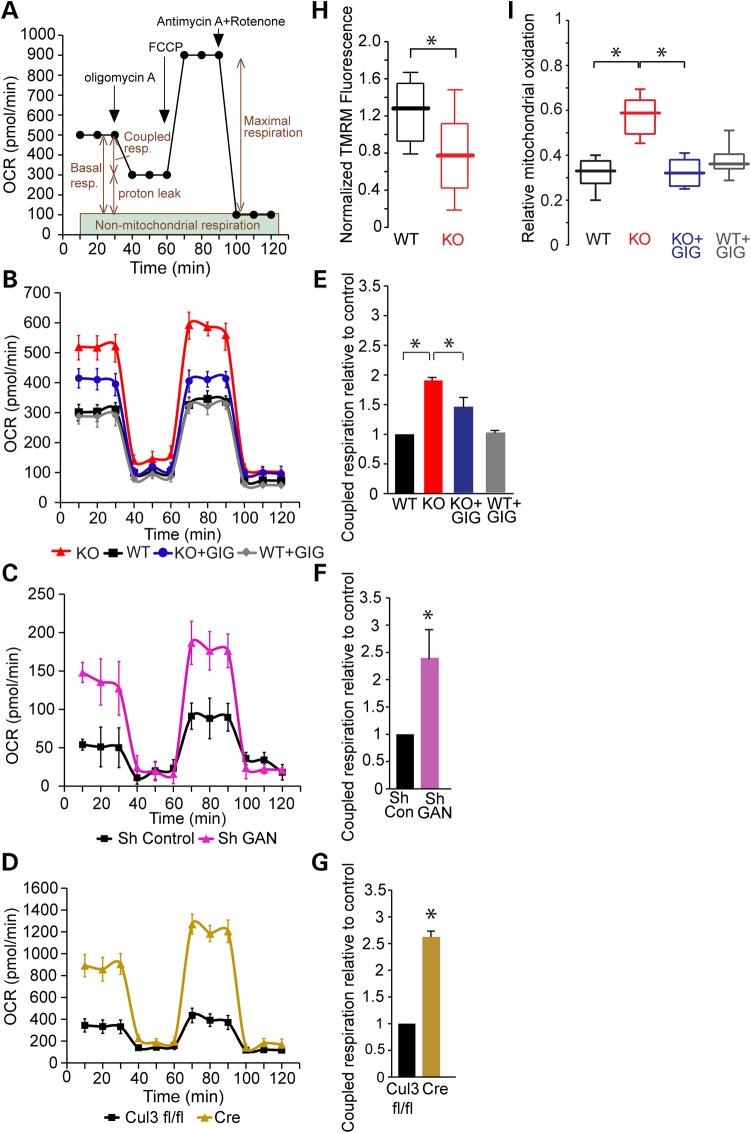
Figure 7.
Mitochondria bioenergetics are altered in GAN KO cultures and accompanied by elevation in oxidative stress. (A) OCR was measured using XF24 Seahorse Biosciences Extracellular Flux Analyzer (see Materials and Methods). (B) OCR measurements of GAN KO and WT DRG cultures at baseline and after expression of FLAG-gigaxonin. (C) OCR measurements of WT DRG cultures after depleting gigaxonin by shRNA (Sh GAN) compared with Sh RNA control (Sh Control). (D) OCR measurements of Cul3-deficient DRG cultures (neurons from Cul3 fl/fl mice infected by lentivirus expressing Cre) compared with uninfected control (Cul3 fl/fl). (E) Coupled respiration rates of cultures described in B. Rates were normalized to WT control and plotted in graph. WT: 1; KO: 1.9 (±0.02); KO + GIG: 1.48 (±0.17): WT + GIG: 1 (±0.02). (F) Coupled respiration rates of cultures described in C normalized to Sh RNA control and plotted in graph. Sh Control: 1; sh GAN: 2.4 (±0.54). (G) Coupled respiration rates of cultures described in D normalized to Cul3 fl/fl-control and plotted in graph. Cul3 fl/fl:1 ; Cre: 2.62 (±0.11). (H) Mitochondrial membrane potential, as measured by TMRM fluorescence, was reduced in DRG neurons from GAN KO mice. Data are presented as box and whisker plots: WT: median 1.28, n = 16; GAN KO: median 0.77, n = 16; KO + GIG median 0.76, n = 19; WT + GIG median 1.14, n = 13. Statistical significance was determined by Mann–Whitney test. *P < 0.05. (I) DRG cultures were infected with adeno-viruses expressing mito-roGFP and oxidative stress was tested by ratiometric measurement of mitochondrial-ro-GFP signal. Relative mitochondrial oxidation presented as box and whisker plots shows approximately two times higher levels in GAN KO neurons compare with WT (WT: median 0.33, n = 21; KO: median 0.59, n = 18). Expression of FLAG-gigaxonin in GAN KO neurons reduced mitochondrial oxidation by ∼2-fold (KO + GIG: median 0.32, n = 20) to levels similar to WT neurons with no effect of expression on WT (WT + GIG: median 0.36, n = 13). Experiments were performed at least four times for each group and statistical significance was determined by Mann–Whitney test. *P < 0.05.

