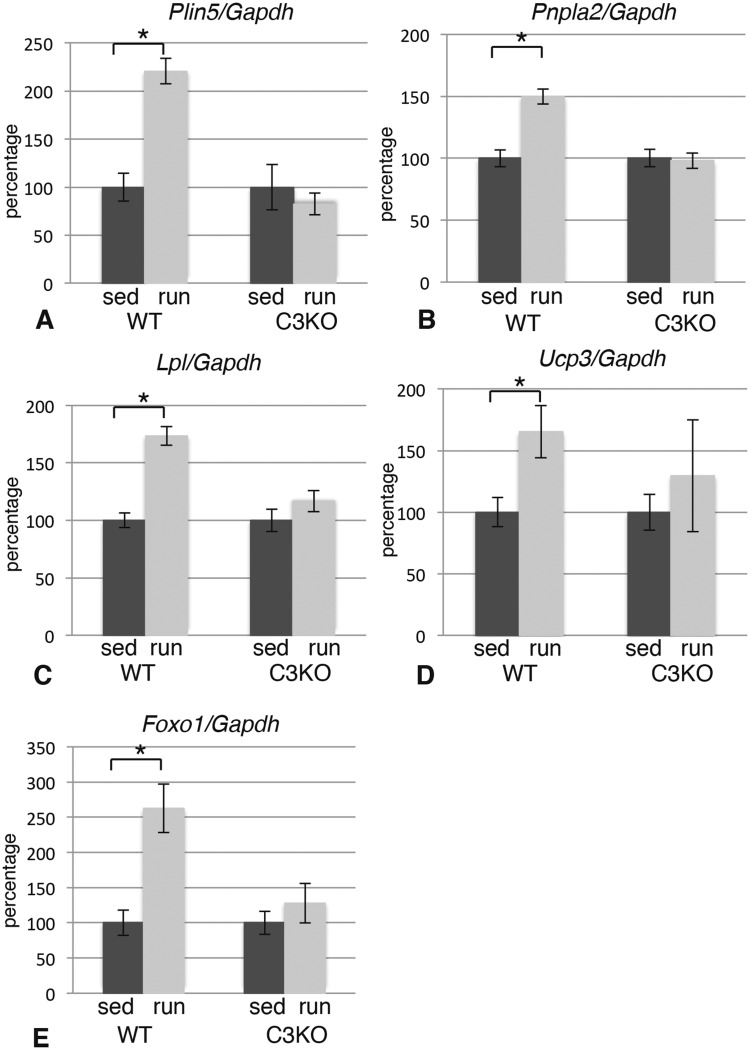
Figure 2.
Exercise does not properly induce expression of lipid metabolism genes in C3KO muscles. RT-PCR validation of the expression levels of genes encoding proteins involved in lipid metabolism and mitochondrial oxidation (Plin5—perilipin 5; Pnpla2—diacylglycerol acyltransferase, ATGL; Lpl—lipoprotein lipase; Ucp3—uncoupling protein 3; Foxo1—transcription factor FOXO1) in plantaris muscles. In each graph, the expression level of the exercised (run) group is graphed relative to the sedentary (sed) control; the average expression of each gene in the sedentary control group was set at 100% for each genotype. Asterisk indicates statistical significance by two-tailed Student’s t-test with P < 0.05 considered statistically significant. All groups had n = 4.

