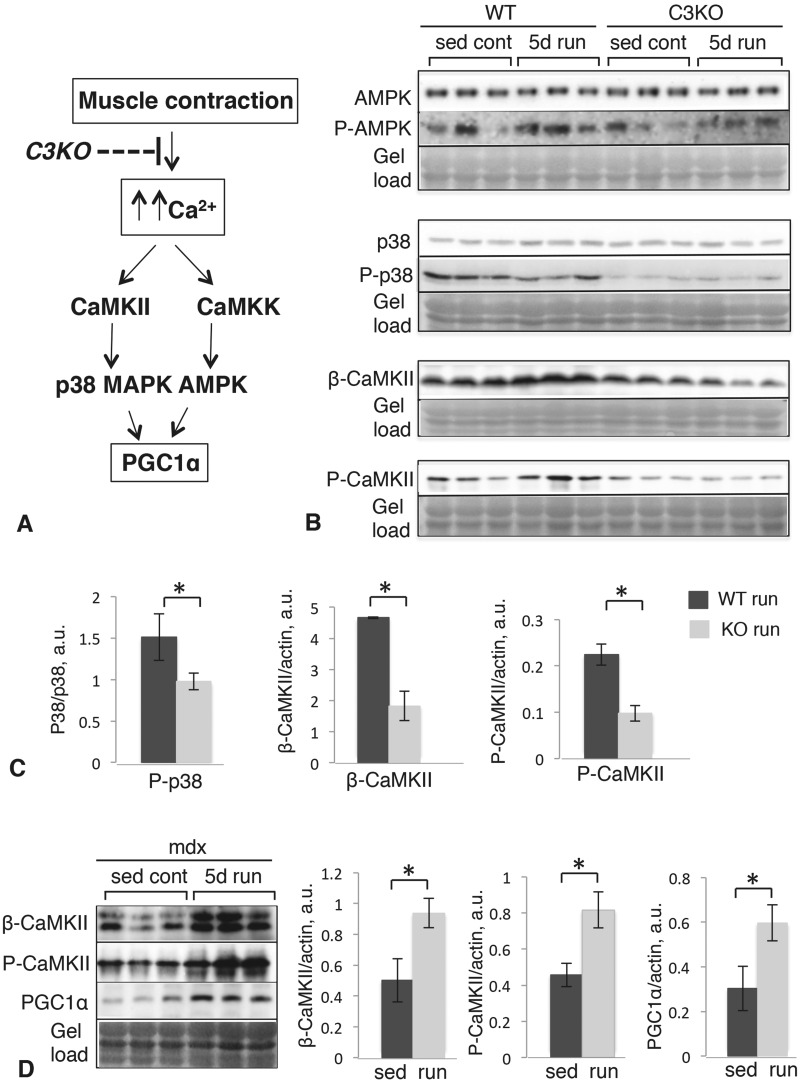
Figure 4.
Western blot analysis of the upstream components of the pathways controlling PGC1α levels in WT and C3KO muscles. (A) Schematic representation of the molecular pathways controlling PGC1α. (B) Western blots of whole plantaris muscle extracts stained with antibodies to total AMPK and phospho-AMPK (top), total p38 and phospho-p38 (middle), β-CaMKII and phospho-CaMKII (bottom). (C) Quantification of the corresponding blots by densitometry; asterisk indicates statistical significance by t-test (P < 0.05). (D) Western blots of whole plantaris muscle extracts of sedentary and exercised mdx muscles stained with antibodies to β-CaMKII (top), phospho-CaMKII (middle) and PGC1a (bottom). Quantification of the corresponding blots by densitometry is shown to the right; asterisk indicates statistical significance by t-test (P < 0.05). Vertical bars represent standard error.

