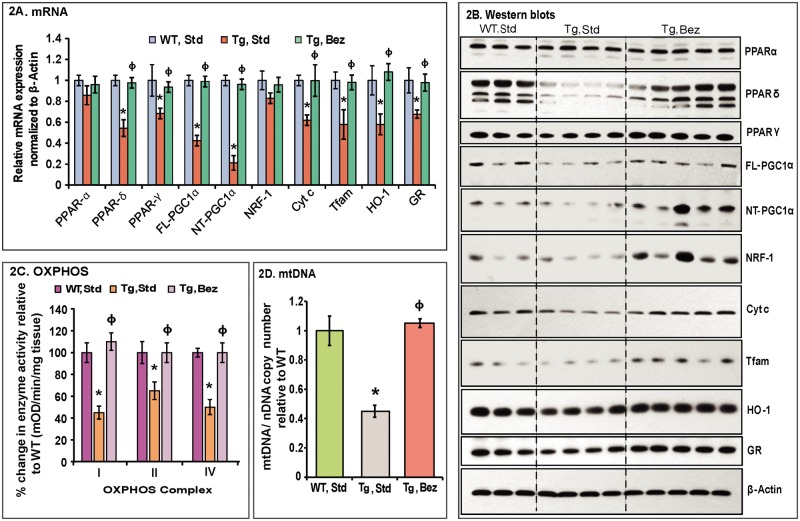
Figure 2.
Bezafibrate restores the PPAR–PGC-1α signaling pathway and induces mitochondrial biogenesis in BACHD mice. (A) Relative expression of PPARα, γ, δ, FL and NT-isoforms of PGC-1α, and the downstream target genes, nuclear respiratory factor NRF-1, Cyt c, Tfam, as well as the oxidative stress response genes HO-1 and GR in striatum of BACHD mice on a standard diet or on the bezafibrate diet. The levels of each gene transcript were normalized to that of β-actin and expressed as fold variation relative to the WT mice on a standard diet. The asterisks and symbols represent the significance levels calculated by one-way ANOVA followed by Tukey–Kramer multiple comparisons test: *P < 0.05 compared with the WT controls; ϕP < 0.05 compared with BACHD controls (n = 5 and bars represent S.E.M., each sample run in triplicate). (B) Representative western blots showing protein expression of PPARα, γ, δ, FL- & NT-PGC-1α, NRF-1, Cyt c, Tfam, HO-1 and GR. 20 μg of protein from striatal lysates of BACHD mice and their WT littermates were separated by SDS-PAGE and immunoblotted with the antibodies. β-actin served as a loading control. (C) Mitochondrial respiratory chain enzyme activities were calculated as mean optical density/min/mg of tissue and expressed as percent change with reference to WT controls. Values were averaged from two independent experiments. *P < 0.05 compared with the WT controls; ϕP < 0.05 compared with BACHD controls, n = 5. One-way ANOVA followed by Tukey–Kramer multiple comparisons test. (D) mtDNA copy number was averaged from two separate experiments utilizing Cyt b or 12S rRNA as the reference gene for mtDNA against the nuclear gene β-actin. Values are expressed as mtDNA/nDNA ratio relative to WT controls. *P < 0.001 compared with the WT controls; ϕP < 0.001 compared with BACHD controls, n = 5. One-way ANOVA followed by Tukey–Kramer multiple comparisons test.

