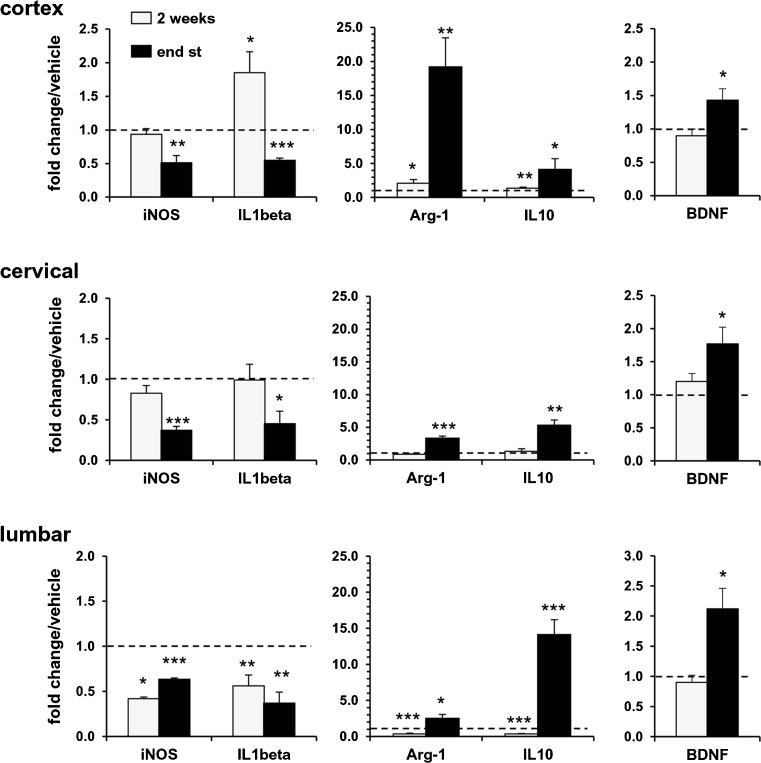
Fig. 5.
Fingolimod modulates M1 and M2 mRNA markers in mSOD1G93A mice. The expression profiles of inducible nitric oxide synthase (iNOS), interleukin (IL)-1β, arginase (Arg)-1, IL-10, and brain-derived neurotrophic factor (BDNF) were examined by real-time polymerase chain reaction in motor cortex, cervical and lumbar spinal cords of mSOD1G93A mice at the same time points as described in Fig. 4 (2 weeks: light bars; end stage of disease: dark bars). As for Fig. 4, expression of each gene is presented as fold change over the expression measured in vehicle-treated animals, taken as 1 (indicated in the graphs by a dotted line), for each brain region examined. After 2 weeks of fingolimod treatment (light bars), mRNA levels of M1 (iNOS, IL-1β) and M2 (Arg-1, IL-10) markers were reduced in the lumbar spinal cord, while no differences were observed in the cervical region. In motor cortex, fingolimod did not affect iNOS mRNA, while mRNA levels of IL-1β, Arg-1, and IL-10 were increased. In all 3 regions, BDNF expression was not affected. After chronic treatment (dark bars), iNOS and IL-1β mRNA levels were substantially decreased in spinal cord regions and in the motor cortex. Arg-1, IL-10, and BDNF were significantly upregulated in all 3 regions of drug-treated mice respect to vehicle group. Data, analyzed by the 2∆Ct method, are expressed as mean ± SEM (n = 4–6); *p < 0.05, **p < 0.01; p < 0.001

