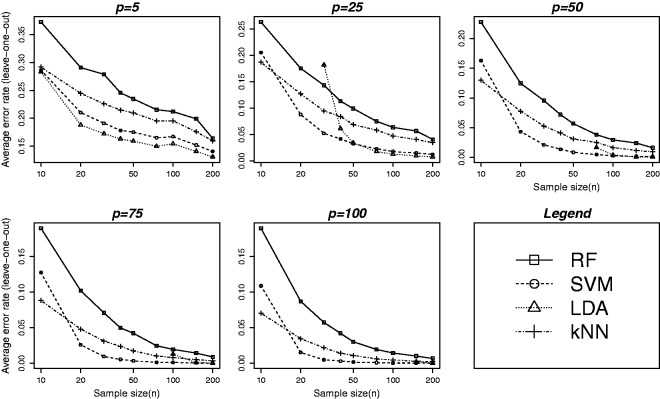
Figure 2.
Average leave-one-out cross-validation error at varying levels of training sample and feature set sizes. Error rates are plotted against nine different values of n as given in Table 1. The five plots correspond to five different values of p (feature set size): 5, 25, 50, 75 and 100, respectively. All other parameters are set to fixed values: (). Although the performance of SVM was found to be better than the other methods (see Figure 1) for larger training samples and feature sets, the method does not perform well for smaller () samples. The plot suggests that the sample size should be at least 20 for SVM to have its superior performance. Error rates for LDA are not shown for sample sizes smaller than the number of variables (p) as the method is degenerate for . Although LDA is theoretically valid for any , it can perform very poorly when the feature set size is very close to the training sample size. The plot suggests that n should be at least as big as for LDA to have comparable performance.

