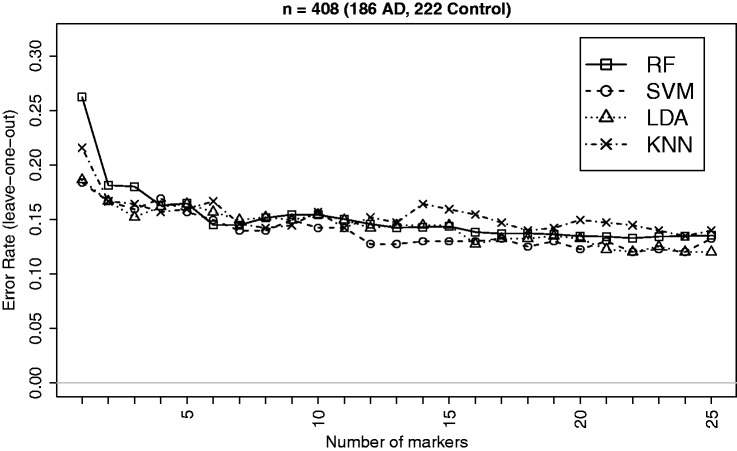
Figure 5.
Leave-one-out CV errors for classifying 408 patients into AD and Control groups based on top imaging measures. There is very little differences between the performances of the methods, which is expected due to larger effect sizes and is supported by the findings from simulation indicating that the performance differences gets narrower as the effect size increases.

