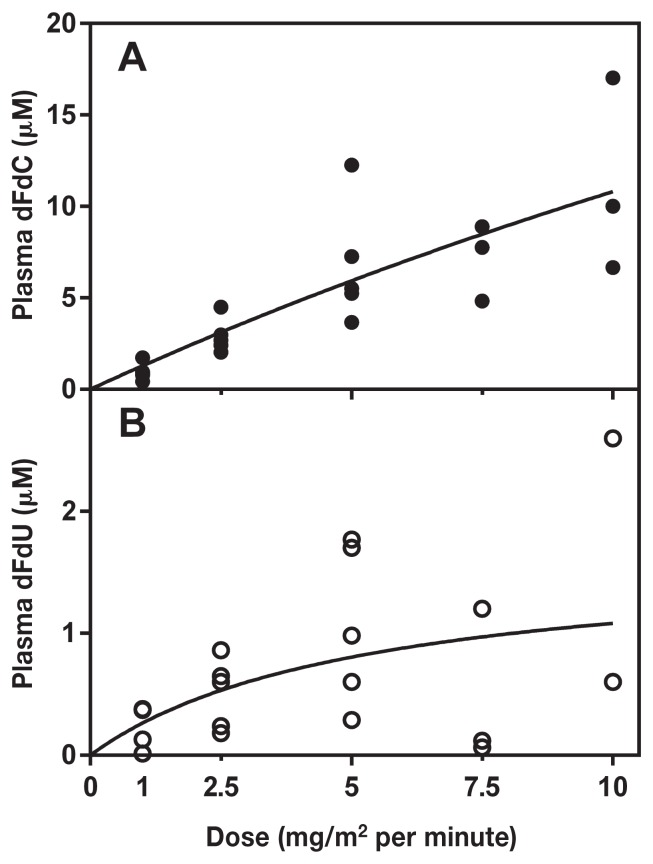
Figure 1.
Plasma levels of gemcitabine and dFdU after a 1-hour infusion in cats. Gemcitabine was administered at 1, 2.5, and 5 mg/m2 per minute (n = 5 cats) and at 7.5 and 10 mg/m2 per minute (n = 3 cats) for 1 h. Plasma was obtained at the end of the infusion and levels of gemcitabine (A) and dFdU (B) in deproteinated plasma were quantitated by HPLC and plotted using a non-linear fit as described in Materials and methods.

