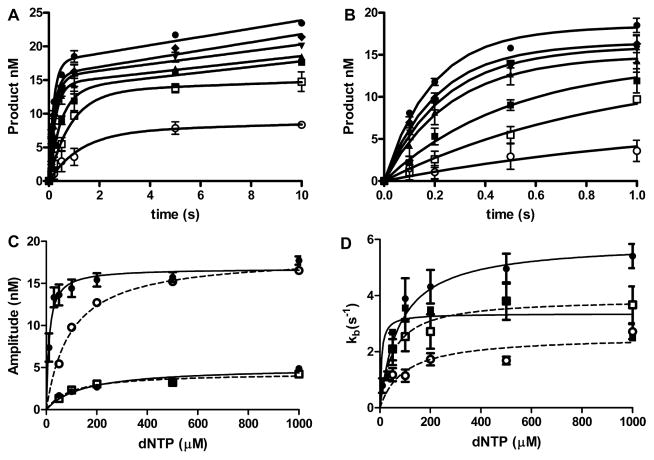
Figure 4.
Pol η catalyzed insertion of dNTPs opposite O2–POB-dT. (A) Pol η (250 nM) and O2–POB-dT DNA (25 nM) were reacted with 10 μM (open circle), 30 μM (open square), 50 μM (square), 100 μM (up triangle), 200 μM (down triangle), 500 μM (diamond), and 1000 μM (circle) dATP. (B) Early time points from panel A. The lines are the best fit to the burst equation. The data points are the mean of three experiments ± standard deviation. dNTP concentration dependence on the (C) amplitude and burst rate constant (D) of the pol η catalyzed insertion of dNTPs opposite O2–POB-dT. The error bars are the standard errors. The lines (solid for dATP and dGTP, and dotted for dCTP and dTTP) are the best fit to eq 1 for dATP (black circle), dCTP (open square), dGTP (black square), and dTTP (open square).

