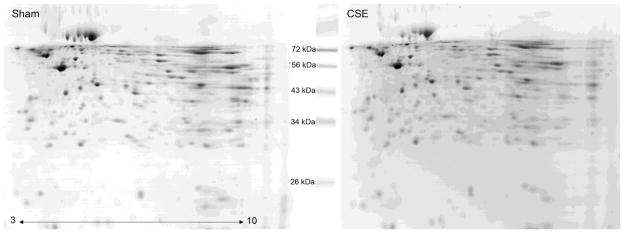
Figure 2. Side-by-side comparison of protein spot patterns of kidney from the Sham and developmental CSE groups.
A side-by-side comparison of kidney protein spot separation based on isoelectric focusing point (horizontal) and molecular weight (vertical) in the two experimental groups (Sham-left; CSE-right). The gels are similar with regard to the number of spots without the appearance or loss of spots between groups.

