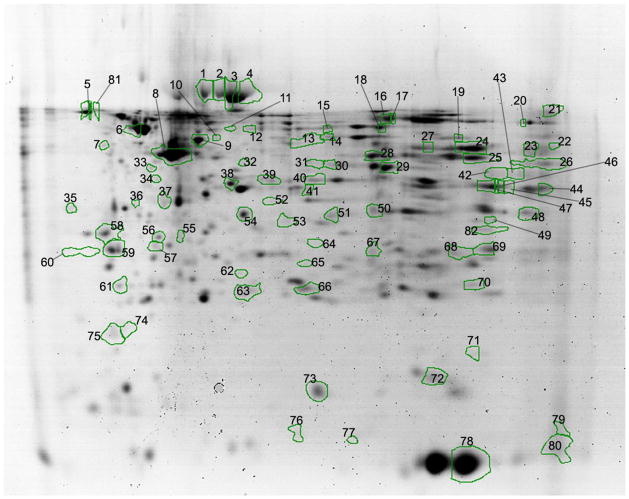
Figure 4. Kidney proteome profiles of 6 month old offspring previously developmentally exposed to cigarette smoke.
The proteins with altered abundance that contributed to the separation of the groups within the PLS-DA model and possessed the highest VIP values (≥1.75) are numbered (as well as a limited selection of unaltered proteins) Refer to Tables 1–3, for a listing of proteins identified in each spot.

