Abstract
The use of light sensitive polymers for the release of therapeutics is an important approach allowing the timing and amount of the release to be controlled precisely. We have pioneered the use of light to control insulin release from a dermal photoactivated depot, or PAD. One of the main impediments to the use of light sensitive polymers in this context is the density of the materials: The large majority of the material is the carrier polymer, with the minority being the therapeutic. In this work, we demonstrate the feasibility of using insulin itself as a monomer in the polymerization process. We use insulin modified with either one or two light cleavable azide groups and polymerize them with a tridentate alkyne bridging monomer using a click reaction. The resulting material which we call a “macropolymer” is ~90% insulin, is insoluble in aqueous solvent and releases native, soluble insulin upon irradiation.
Keywords: depot, photoactivation, insulin, click reaction
Graphical Abstract
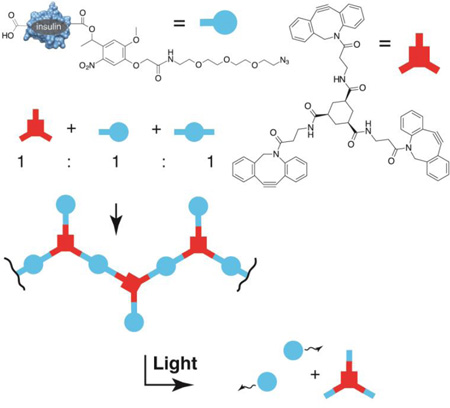
To make highly efficient light activated depots of insulin, we have used insulin itself as a monomer during click-driven polymerizations. The resultant materials have the key desired properties including high insulin density, insolubility prior to irradiation and release of native insulin in response to light.
Introduction
We have recently described the controlled release of a protein (insulin) from a polymer using light.1 The aim of such a material is to create what we call a Photoactivated Depot, or PAD. We envision such materials as being an effective way of controlling insulin release in response to blood sugar information. A PAD material can be injected intradermally, and then be stimulated to release insulin via transcutaneous irradiation. Because insulin is required in small but highly variable amounts, such a depot could eliminate the majority of injections while allowing for minute by minute adjustment of blood sugar through minute by minute variation of insulin release. As such, they can be an effective delivery component of an artificial pancreas.2, 3, 4, 5
Our first described material used an insoluble polymer, linked to insulin using a photocleavable linker. The purpose of the polymer is to keep the insulin insoluble and at the injection site prior to irradiation. The insulin remains inert, until light breaks insulin’s bond with the polymer, allowing it to be absorbed into systemic circulation. One of the key design requirements of such materials is density, i.e. the proportion of the material that is insulin. Density increases the lifetime of the depot and increases the rate of insulin release. Using a polymer base however reduces this density because the large majority of the atoms in the material are contained within the polymer, not the insulin. In this work, we explore an intriguing possibility, namely that the polymer itself could be formed using the protein, insulin, as a monomer, copolymerized with low molecular weight, photocleavable linkers. The resultant “macropolymers” could achieve dry weight efficiencies approaching 90%.
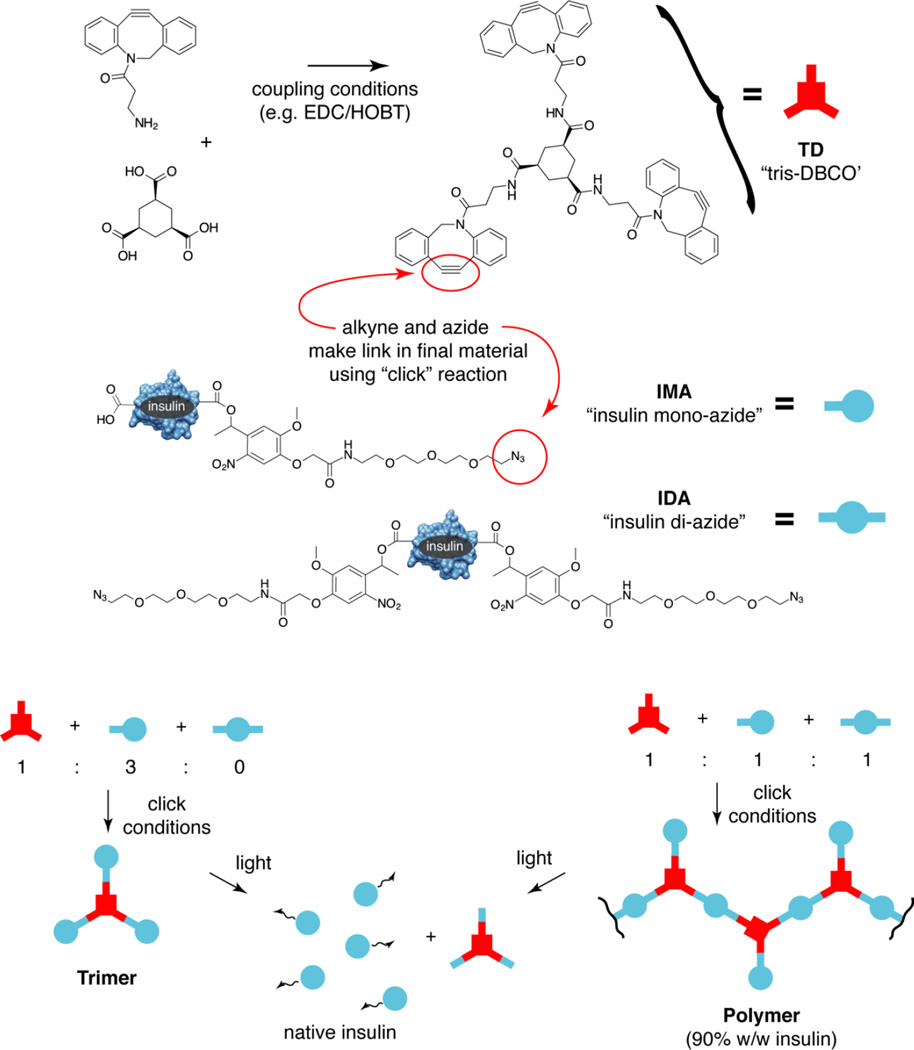
We have achieved this aim, using three monomer species in the polymerization: insulin mono-azide (insulin with a single photocleavable, azide terminated group attached), insulin di-azide (insulin with two photocleavable, azide terminated groups attached) and TD (for tris-DBCO a linker with three strained octyne DBCO groups that can react with and crosslink the azide containing protein monomers). We demonstrate that this polymer is efficiently synthesized via MS and gel analysis. We then show that it is insoluble in buffer and photolyzes to release insulin and a small amount of residual linker.
Results and Discussion
For the ultimate synthesis of the target macropolymer, we require the three species indicated in scheme 1, namely insulin mono-azide (IMA), insulin diazide (IDA) and the linker TD. Depending on the ratio of these three species we expected to form different species. For example, a ratio of 3:1 IMA:TD should predominantly give the simple trimer shown. A ratio of 1:1:1 IMA:IDA:TD should give a random mixture of larger oligomers and polymers as shown. Other ratios could lead to closed polyhedra with interesting properties.
Scheme 1. Macropolymer synthesis from insulin mono-azide and di-azide.
We have previously described the synthesis of IMA and IDA.1 These were formed upon the reaction of the precursor diazo-DMNPE-azide (DDA) with insulin, resulting in two main peaks upon HPLC analysis. We originally demonstrated by MS that these two peaks were IMA and IDA respectively. Subsequently, with better chromatography, we have demonstrated that these “single” peaks are in fact a collection of closely related isomers, each consistent with IMA (in the first cluster) or IDA (in the second cluster) (figure S1–S5). This is to be expected, as the diazo moiety of DDA can react with any of the six carboxyl groups found in insulin. Therefore there are six possible IMA and fifteen possible IDA isomers. We use the entire cluster of singly modified species as “IMA” and the entire cluster of doubly modified species as “IDA”. The new linker molecule TD was synthesized by condensation of cyclohexane tri-carboxylic acid with the strained octyne amine DBCO.6, 7, 8 This structure and purity was confirmed by NMR, MS and HPLC. (Figures S6–10).
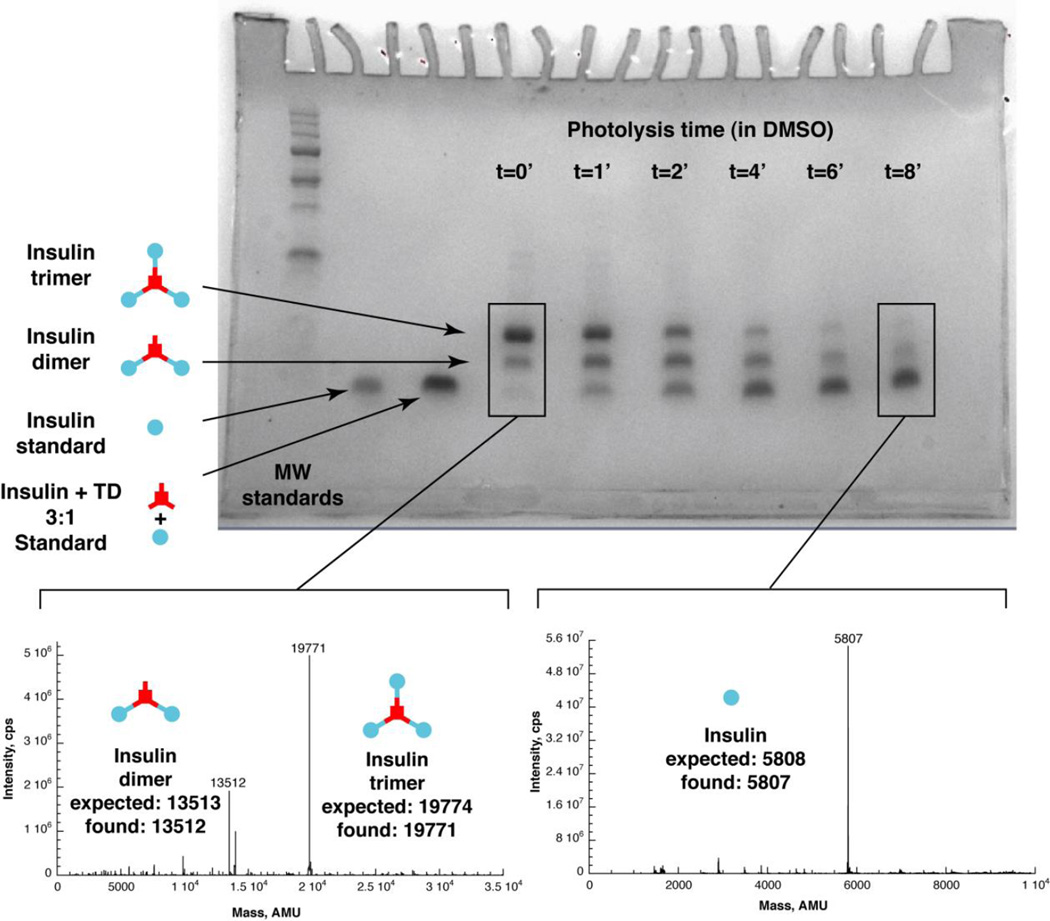
For the first and simplest demonstration of reaction of TD with an insulin-azide, we synthesized the trimer. This was synthesized by reacting a 3.3:1 ratio of the IMA:TD in DMSO. The resulting material gave a cluster of three bands with the smallest species (with lowest intensity) consistent with the insulin standard. (Figure 1) We interpret the middle band, equidistant from the lower and upper bands, to be the doubly reacted species, and the highest (and major band) being the expected trimer. This sample gave a MS showing the trimer as the major product and the doubly reacted species as a minor product (Expected [M] 19774, Found [M] 19771, Expected [M] 13513, Found [M] 13512 Figure 1).
Figure 1. Gel analysis of insulin trimer and photolysis in DMSO.
Gel, Lane 1: molecular weight standards. Lane 2: standard insulin. Lane 3: standard 1:3 TD:insulin mixed. Lane 4: 1:3.3 TD:IMA product (“trimer”) at time 0. Lane 5–10: Trimer product irradiated for 1 min., 2 min., 4 min., 6 min., 8 min., by a fluorescent light source. Lower left mass spectrum: Deconvoluted ESI-MS of product of 1:3.3 TD: IMA reaction. Expected mass of trimer 19774, found 19771. Dimer also observed. Expected mass of dimer 13513, found 13512. Lower right mass spectrum: Mass spectrum of insulin trimer photolyis product in DMSO. Deconvoluted ESI-MS of sample from 8 minute time point. Insulin expected mass 5808, found 5807.
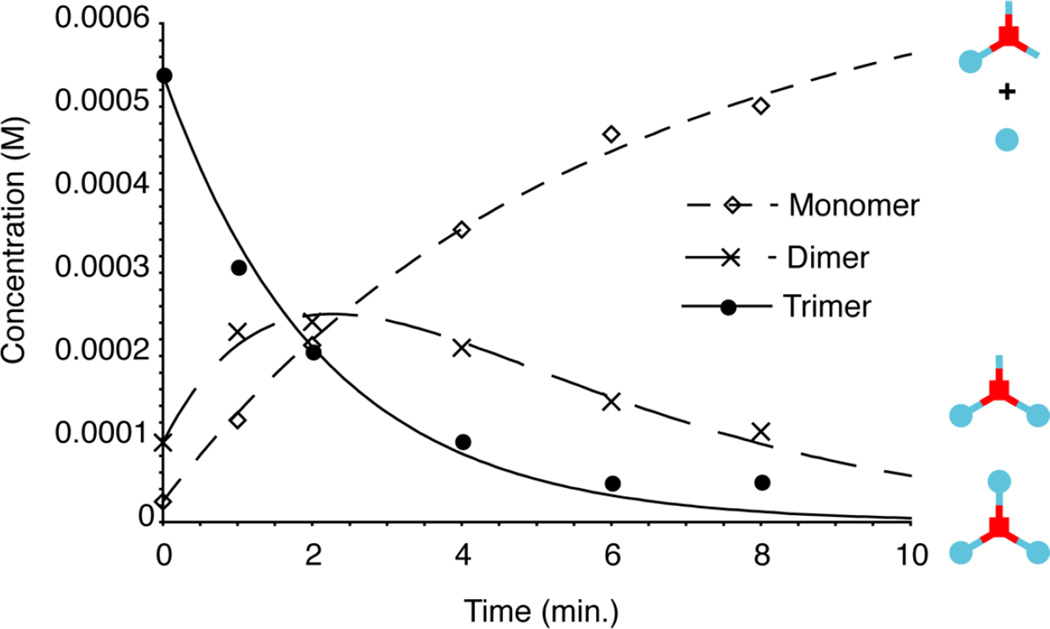
We then photolyzed this material in DMSO, to demonstrate the release of insulin as a result of photolysis. The trimer was completely soluble in DMSO, as were the reaction products. We used a 365nm centered Blak-Ray light source for this irradiation, and analyzed the products by PAGE (figure 1). These show an interconversion of the higher band to the lower bands, ultimately resulting in a majority of insulin being formed. We analyzed the final time point by ESI-MS and confirmed that this was insulin (figure 1). The bands at each time point were quantitated using Photoshop, and then plotted (figure 2). The kinetic plots are well fitted by the equations for two sequential first order reactions, as would be expected from photolysis events (equations based on work by Benson).9 There are actually three first order reactions expected, but the final conversion of insulin with a single TD attached to insulin is “silent” because both species have the same mobility under the gel conditions used. Details of the kinetic scheme and fitting can be found in the Supplemental Information section. The rate of trimer photolysis is approximately 10 fold higher than observed previously for insulin diazide photolysis. This is likely due to the difference in solvent used during the photolysis (water with insulin diazide in the previous work, and DMSO with the trimer in the current work). DMSO was used for trimer photolysis because the trimer has low solubility in water.
Figure 2. Kinetic analysis of trimer photolysis in DMSO.
Concentrations of trimer (top band on gel, solid circles), dimer (middle band on gel, x’s), and monomer/insulin (lower band on gel, diamonds), as determined by gel quantitation, versus time. Fit curves are for sequential first order reactions in which trimer is converted to dimer (+insulin), and dimer is converted to monomer/insulin. Described in detail in text and supplemental section.
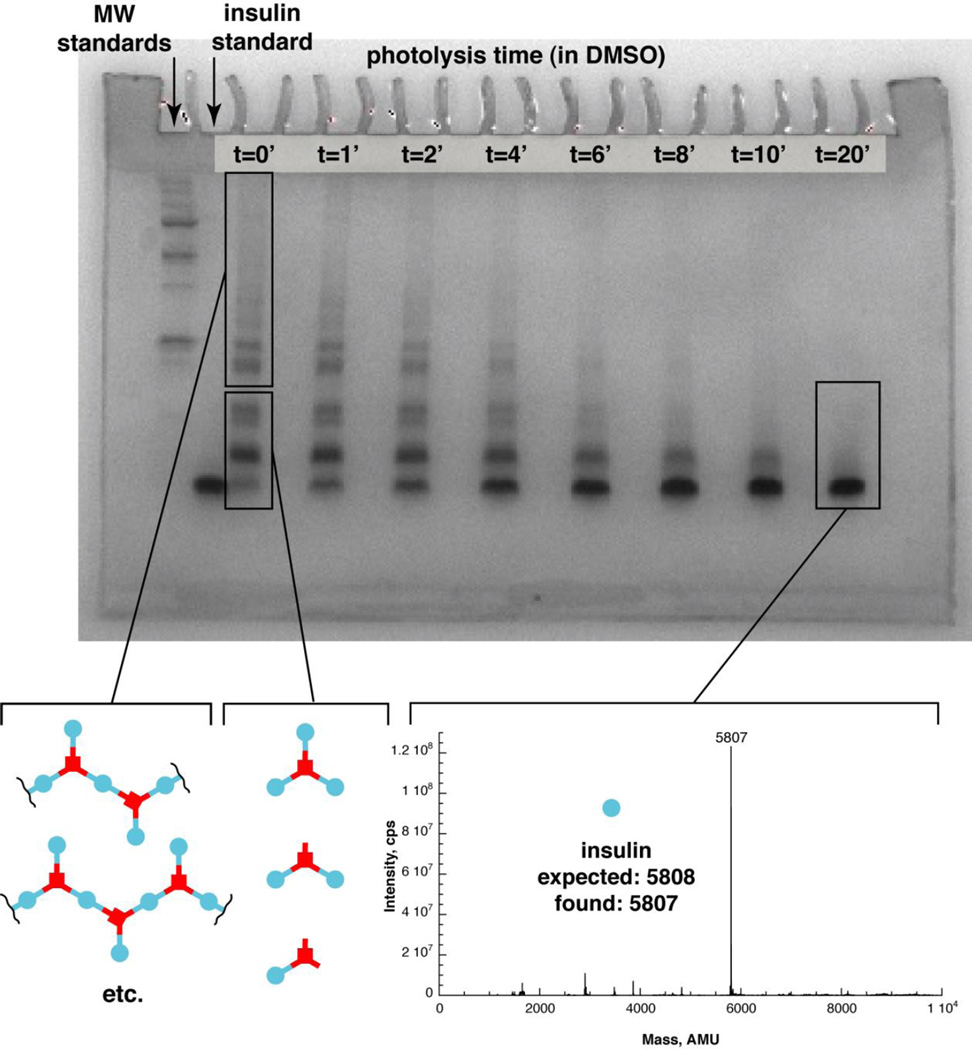
We then synthesized the polymer using a 1:1:1 ratio of IMA:IDA:TD, again in DMSO. The resulting products were analyzed using PAGE electrophoresis and samples loaded in a 1:1 mixture of DMSO:loading buffer, in which they were soluble (figure 3). At time 0 we see multiple bands, including species similar to those seen in the trimer. In addition we see a series of higher bands going progressively up the gel to higher molecule weight, ultimately ending in a “smear”. Insulin alone (i.e. without azide functionalities attached), identically treated, shows only a single band on the gel as expected, and so we interpret the reaction product bands as being increasing size oligomers and at the extreme end of the gel, polymers of insulin. It is interesting to note that the second band from the bottom, interpreted as two insulins attached to TD is particularly intense. We speculate that this is due to a second azide group on a 1:1:1 IMA:IDA:TD adduct “looping” back to react with the free DBCO valence on the TD. We would expect that this looped back adduct will quench polymerization. It may be possible to suppress this by modifying the arm length (and flexibility) on the IMA, IDA and or TD molecules. We determined from gel quantitation that insulin 2–8 mers constitute 80% of the products, where 9mers and higher constitute 20% of the products. While our initial aim was a greater proportion of higher molecular weight species, the material as synthesized has the key properties that we seek, namely insolubility prior to irradiation followed by release of native insulin after irradiation.
Figure 3. Gel analysis of insulin polymer and photolysis in DMSO.
Gel, Lane 1: Molecular weight standards ladder. Lane 2: insulin. Lane 3: Insulin polymer mixture (1:1:1 TD:IMA:IDA) at time 0. Lanes 4–10: Insulin polymer solution after photolysis of 1 min., 2 min., 4 min., 6 min., 8 min., 10 min., 20 min. using a 365nm Blak-Ray lamp. Mass spectrum of polymer photolysis product in DMSO (lower right): Deconvoluted ESI-MS of product formed after 20 minutes of photolysis of the insulin polymer. Expected mass for insulin: 5808. Observed: 5807.
To demonstrate that the polymeric material can be photolytically converted to insulin, we irradiated it using the 365nm Blak Ray lamp, again in DMSO where it, and the products are completely soluble. During photolysis, we observe the higher molecular weight bands being progressively converted to lower molecular weight bands, until ultimately at the 20 minute time point, we observe approximately complete conversion to insulin. We again confirmed that the material in this band was insulin by ESI-MS analysis of the final time point (figure 3).
The study described above was performed in DMSO, to allow for the analysis of the products formed, and to demonstrate the interconversion of higher molecular weight species into insulin by irradiation over time. DMSO effectively solubilizes both insulin and its higher oligomers, allowing for direct visualization on gel analysis, however it is possible that the highest molecular weight materials are not as visible in the gel analysis due to reduced solubility. As effective as DMSO is at facilitating analysis of the polymerization products and photolysis products, it is not representative of the real world and long term application of these materials. The purpose of these materials is to be initially insoluble in aqueous solution (at the site of insulin depot injection), and then to release soluble insulin in response to light.
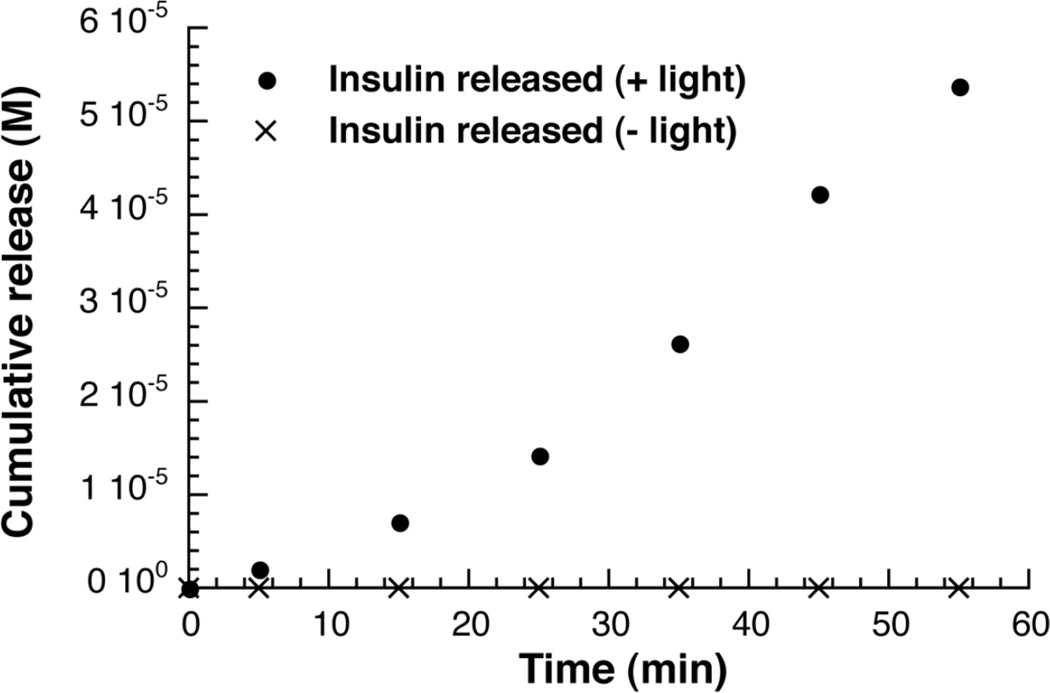
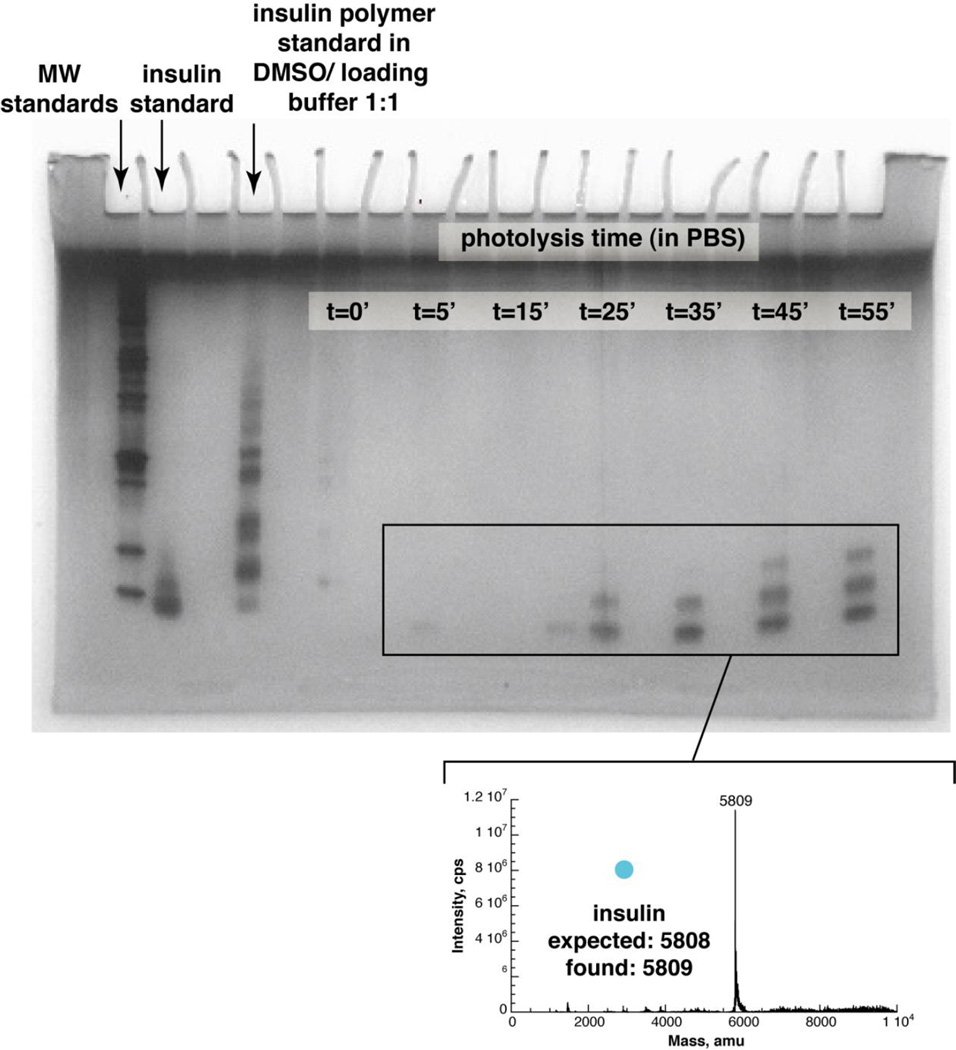
To test this potential, we analyzed the polymeric material in phosphate buffered saline (PBS) instead of DMSO. In contrast to DMSO, the polymer was completely insoluble in PBS. We confirmed this with two methods of analysis of the supernatant above the polymer, silver stained PAGE gel analysis, and ELISA analysis. Both showed no detectable insulin in the supernatant above the material (figure 4 and 5) prior to irradiation. We then irradiated the sample, using a 365nm LED (Nichia), a source that is more intense than the Blak-ray lamp. We have found that inhomogeneous photolysis of insoluble materials (such as the polymeric material here, or previously studied resin bound insulin) require greater intensity light to effect photolysis.
Figure 4. Insulin polymer photolysis in PBS, analyzed by ELISA.
Supernatant above insoluble insulin polymer analyzed for insulin in the presence (solid circles) and absence (x’s) of irradiation from a 365nm LED light source. Concentration of insulin determined using ELISA assay and plotted versus time of irradiation.
Figure 5. Gel analysis of insulin polymer and photolysis in PBS.
Supernatant above insoluble insulin polymer analyzed by silver stained PAGE gel. Lane 1: molecular weight markers. Lane 2: Insulin. Lane 3: Insulin polymer, loaded in DMSO to maintain solubility. Lane 3–10: Supernatant above insulin polymer in PBS, analyzed after 0 min., 5 min., 15 min., 25 min., 35 min., 45 min., 55 min. of irradiation from a 365nm LED light source. Mass spectrum of polymer photolysis product in PBS. Samples from time 5, 15, 25, 35, 45 and 55 minute combined, desalted and analyzed by ESI-MS, with deconvolution. Expected mass for insulin: 5808. Observed: 5809.
With both gel and ELISA analysis, we demonstrate insulin being released into the supernatant. The ELISA analysis appears more sensitive, able to capture the very earliest release of insulin. The 55 minute point represents in absolute terms a release of 4.7% of the total insulin contained in the material. Interestingly, there is a lag observed in insulin release, which is to be expected as initial photolytic events cleave some bonds that do not release insulin, but rather break the polymer into smaller, but still insoluble pieces. With time, the rate of release increases, as these smaller pieces are further photolyzed to form insulin. The ELISA analysis also demonstrates that polymeric material that is not irradiated, but is otherwise identically treated shows no release of insulin, confirming the photolytic nature of the release process (figure 4). A positive ELISA signal with irradiated samples also supports that insulin remains in a native conformation, as it is still recognized by two distinct antibodies after photolysis.
The gel analysis (figure 5) parallels the ELISA results, showing low or undetectable insulin release at early time points, followed by increasing amounts with increased irradiation. For a point of comparison, we also loaded solubilized polymeric material onto the gel, solubilized using 1:1 DMSO:loading buffer. It is interesting to observe that in addition to the insulin band, two higher bands are also seen during photolysis. These may be the smallest pieces of the polymer that are soluble after photolysis or another unknown species. Their solubility may be increased in this experiment because of heating due to the intensity of the LED light source. When desalted and analyzed by ESI-MS, the combined time points indicate a mass of 5809, confirming that it is insulin (figure 5) being released. No readily detected higher molecular weight species are found in the mass spectrum.
Conclusions
In this work we have demonstrated the feasibility of making new polymeric materials that release proteins in response to light, by using the proteins themselves as monomers, linked by small light cleaved linkers. These materials relate to prior work involving click chemistry, photosensitive polymers, and telechelic polymers.2, 10, 11, 12, 13, 14, 15, 16, 17, 18 For the purposes of creating a photoactived insulin depot, the new materials approach ideality. The resin bound approach we previously described utilized an inert polymer, linked to insulin via a light sensitive linker. As such, the efficiency of the material was very low, with <5% dry weight being insulin, and the remainder being the polymer (needed to keep the insulin insoluble at the site of injection). With the macropolymer approach described herein, approximately 90% of the dry weight of the material is insulin. This is because the insulin itself is the predominant monomer that makes the polymer. Insulin density is key for three reasons: It increases the potential lifetime of a given injection volume, it reduces the total volume needed to provide an effective dose, and finally, it reduces the amount of light that needs to access the depot (by increasing the density of photolytically active sites.)
In addition to density, this material has three features that are key for its effectiveness as an insulin depot. It is completely insoluble in aqueous solution prior to irradiation, and then releases soluble insulin efficiently in response to light. In addition it is completely “biodegradable”, in so far as the consumption of the depot leaves only small, diffusible linkers after photolysis. The combination these attributes, make light sensitive macropolymers of insulin an ideal starting point for the creation of efficient photoactivated insulin depots. In addition, the approach should allow for the release of any protein from a highly efficient and dense material in a light controlled manner.
Experimental Section
(Complete materials and methods including NMR, MS and HPLC results can be found in the Supplementary Information Section)
Acetovanillone, t-Butyl bromoacetate, nitric acid, 11-azido-3,6,9-trioxaundecan-1-amine, magnesium sulfate, hydrazine, manganese dioxide, molecular sieves, 1,3,5-Cyclohexanetricarboxylic acid (cis 95%) and human recombinant insulin were purchased from Sigma Aldrich. DMSO and DMF were stored over molecular sieves containing glass vial and used as stated. DMF, DMSO, DCM, acetonitrile, methanol, ethanol, ethyl acetate, sodium chloride, potassium carbonate, trifluoroacetic acid, acetic anhydride, 1 N HCl, diethyl ether, sodium bicarbonate, Celite545, 10x SDS PAGE running buffer were purchased from Fisher Scientific. DBCO amine (Click Chemistry Tools), hydroxybenzotrizole hydrate (Peptide International), 1-Ethyl-3-(3-dimethylaminopropyl)carbodiimide hydrochloride (Calbiochem), Spin-X UF 5K NMWL membrane (Corning), Flat bottom glass vial insert 100 µL, diameter 3.4 mm (inner), 4.5 mm (outer), height 30.5 mm (Agilent, 5183-2090), Criterion TGX Any Kd precast gel (Bio-rad), Silver stain kit (Pierce), polypropylene white 96-well plate (BD Falcon), ultrasensitive human insulin ELISA kit (Alpco).
High field NMR was performed for 1H (400 MHz) or 13C (100 MHz) in d6-DMSO (99.9% atom D) containing 0.03%–1% v/v TMS using a Varian Inova 400 MHz NMR. UV-Vis analysis was performed using a USB-2000 fiber optic spectrometer (Ocean Optics, Inc.) with DT-Mini-B lamp source. HPLC analysis was performed using a modular Hewlett Packard Agilent 1050 series with attached vacuum degasser, auto sampler and diode array detector. C18 Hypersil (5 µm, 100 × 4.6 mm, Varian) column was used as stated in the method. For HPLC purification C18 (5 µm, 250 × 10 mm, Phenomenex) column was used. HPLC-MS and MS-infusion analysis was performed using Q-Trap 3200 (ABI). The polyacrylaminde gel was run on Criterion vertical midi-format electrophoresis cell (Bio-rad) at 150v.
Preparation of insulin mono-azide (IMA) and insulin di-azide (IDA)
Manganese (IV) oxide (110 mg, 1265 µmol) was added to a solution of hydrazone-DMNPE-azide (21.96 mg, 45.46 µmol) in 468 µL of anhydrous dimethyl sulfoxide (DMSO). This mixture was shaken gently for 45min keeping it protected from light. The red-black mixture was centrifuged and the supernatant was filtered through Celite 545 using glass-wool/glass-pipette. This celite pad was washed multiple times with total of 1062 µL of DMSO. Human recombinant insulin (100.8 mg, 17.35 µmoles) was dissolved in 7.1 mL anhydrous DMSO. The freshly prepared diazo-DMNPE-azide (DDA) was added to insulin solution and gently shaken for 24 hours protecting it from light. The mixture was freeze dried and reconstituted in 0.01N HCl. The sample was then filtered and washed twice with 0.01 N HCl using a spin filter (Corning Spin-X UF 500 concentrator) by following manufacturer’s protocol. This was to remove excess reagents, while retaining the caged insulin products.
The mixture was recovered from the filter by dissolving in 0.01N HCl. Insulin monoazide and insulin diazide were purified by using reversed phase HPLC. Reversed phase HPLC (flow rate 2 mL/min, runtime 45 minutes with 5 minutes post-run) solvent A (0.1% TFA in H2O), solvent B (0.1% TFA in acetonitrile (ACN)), gradient 0% B to 70% B over 45 minutes, C18 Hypersil column (5 µm, 250 × 10 mm, Phenomenex), relative yield (%); insulin (45.9%) mono-azide insulin (40.7%); di-azide insulin (13.3%). It was purified multiple times to prepare in bulk and appropriate fractions were combined. After freeze drying it was reconstituted in DMSO to make final stock solutions. Each specie was infused into mass spec in 0.01N HCl at 10 µM concentration. ESI−MS (m/z): [M] calculated for, insulin mono-azide, 6261; found, 6261; [M] calculated for insulin di-azide, 6714; found, 6712. Extinction coefficient (ε 280 nm): mono-azide (8400 M−1 cm−1), di-azide (11672 M−1 cm−1). Reversed phase HPLC (flow rate 1 mL/min, runtime 30 minutes) solvent A (0.1% TFA in H2O), solvent B (0.1% TFA in acetonitrile (ACN)), gradient 0% B to 100% B over 30 minutes, C18 Hypersil column (5 µm, 100 × 4.6 mm, Varian): retention time; mono-azide insulin, 18 min; di-azide insulin, 19 min.
Synthesis of tris-DBCO (TD)
1,3,5-Cyclohexanetricarboxylic acid (6.94 mg, 32.1 µmoles), DBCO amine (40.6 mg, 146.9 µmoles) and hydroxybenzotrizole hydrate (22 mg, 143.6 µmoles) were dissolved in 300 µL of dimethylformamide (DMF). Then to this, 1-ethyl-3-(3-dimethylaminopropyl)carbodiimide hydrochloride (29 mg, 151.2 µmol) was added. The reaction was allowed to go for 18 hours. The product was purified using reversed phase HPLC and correct fractions were collected, combined and dried using rotovap. HPLC purification (flow rate 2 mL/min, runtime 40 minutes) solvent A (H2O), solvent B (acetonitrile (ACN), gradient 0% B to 10% B over 30 minutes, isocratic 100% B for 10 minutes, 5 minute post run with 100% A, C18 column (5 μm, 250 × 10 mm, Phenomenex). Yield 14.1 mg (44.3%); 1H NMR (400 MHz, DMSO-d6) d ppm 1.04 – 1.18 (m, 1H) 1.23 (s, 2H) 1.42 (d, J=11.71 Hz, 1H) 1.76 – 1.93 (m, 2H) 2.38 (tt, J=14.93, 7.13 Hz, 1H) 2.83 – 3.00 (m, 1H) 3.01 – 3.17 (m, 1H) 3.62 (d, J=14.06 Hz, 1H) 5.03 (d, J=14.06 Hz, 1H) 7.15 – 7.82 (m, 10H); 13C NMR (100 MHz, DMSO-d6): δ 174.3, 170.6, 151.8, 148.8, 132.8, 129.9, 129.3, 128.6, 128.4, 128.1, 127.2, 125.6, 122.8, 121.9, 114.8, 108.5, 55.2, 42.9, 35.4, 34.6, 31.7, 29.4, 29.1 ;UV/vis (methanol): 312 nm (34500 M−1 cm−1); Reversed phase HPLC−MS (flow rate 0.4 mL/min, runtime 35 minutes) solvent A (0.1% formic acid in H2O), solvent B (0.1% formic acid in acetonitrile (ACN)), gradient 0% B to 50% B over 15 minutes, gradient 50% B to 100% B over 30 minutes, isocratic 100% B for 3 minutes, 100% B to 0% B over 2 minute, C18 Hypersil column (5 µm, 100 × 4.6 mm, Varian): retention time (min) 22.31; ESI−MS (m/z): [MH]+ calculated for C63H54N6O6, 991.4; found, 991.5; Reversed phase HPLC (flow rate 1 mL/min, runtime 35 minutes) solvent A (0.1% TFA in H2O), solvent B (0.1% TFA in acetonitrile (ACN)), gradient 0% B to 100% B over 30 minutes, isocratic 100% B for 5 minutes, C18 Hypersil column (5 µm, 100 × 4.6 mm, Varian): retention time (min) 27.48.
Synthesis of insulin trimer
61 µL of Insulin mono-azide (462 nmoles) was added to 16.1 µL of TD (140 nmoles), the solvent was DMSO. The reaction was allowed to go for 48 hours at 37°C in the dark. This stock was used for further studies of insulin trimer. ESI−MS (m/z): [M] calculated for insulin dimer, 13513; found, 13512; [M] calculated for insulin trimer, 19774; found, 19771.
Synthesis of insulin polymer
19.15 µL of Insulin mono-azide (145 nmoles), 16.86 µL of insulin di-azide (145 nmoles) were mixed and added to 16.11 µL of TD (140 nmoles). All stock solutions were in DMSO. The reaction was allowed to go for 48 hours at 37°C in the dark. This stock was used for further studies of insulin polymer.
Photolysis using the lamp
Photolysis of insulin trimer
3.85 µL of insulin trimer mixture (described above) was diluted upto 35 µL in DMSO. The photolysis was done in polypropylene 96 well plate (BD Falcon) using a Blak-Ray lamp (Model XX-15L, 30 watts) source at a distance of 10 cm, the plate was irradiated from the top. At each time point, the irradiation was stopped and 5 µL volume from the mixture was withdrawn. Each time point was analyzed by running SDS-PAGE. The Criterion vertical midi-format electrophoresis system and Criterion TGX Any Kda precast gel was run according to manufacturer’s instructions at 150v for 50 minutes. The Coommassie blue was the staining dye. The final point was also analyzed by mass spec infusion. ESI−MS (m/z): [M] calculated for, insulin, 5808; found 5807.
Photolysis of insulin polymer
6.26 µL of insulin polymer stock was diluted upto 45 µL using DMSO. The photolysis was performed in the identical conditions described earlier using the lamp. At each time point, the irradiation was stopped and 5 µL solution was withdrawn. The samples were run on SDS-PAGE and stained using Coommassie blue. The final time point at 20 min was also analyzed by mass spec infusion. ESI−MS (m/z): [M] calculated for, insulin, 5808; found, 5807.
Photolysis using the LED
Photolysis of insulin polymer in buffer
11.86 µL of insulin polymer stock solution was added to two flat bottom glass vial insert each and freeze dried to remove DMSO. The residue was suspended in 110 µL of PBS. The photolysis was performed using a Nichia 200 mW 365 nm LED source at a distance of 0.5 mm, the vial was irradiated from the bottom. At each time point the irradiation was stopped, the suspension was vortexed, 55 µL supernatant was removed and replaced with the same volume of fresh PBS. The ELISA was performed to determine the concentration of released insulin. The solution was diluted appropriately in zero concentration standard provided with the kit. The samples were run on the gel as described earlier. The staining was performed using silver staining kit (Pierce). For the ESI-MS analysis, all the samples were combined and desalted using 5KDa MWCO spin filter and infused; [M] calculated for, insulin, 5808; found, 5809.
Supplementary Material
Acknowledgments
Research reported in this publication was supported by the National Institute Of Diabetes And Digestive And Kidney Diseases of the National Institutes of Health under Award Number DP3DK106921 as well as the support of a University of Missouri Fast Track Award and the UMKC School of Pharmacy Dean’s Bridge Fund.
We acknowledge Prof. William Gutheil for guidance regarding mass spectrometry issues.
Footnotes
Supporting Information is available online from the Wiley Online Library or from the author.
References
- 1.Jain PK, Karunakaran D, Friedman SH. Construction of a photoactivated insulin depot. Angew Chem Int Ed Engl. 2013;52:1404–1409. doi: 10.1002/anie.201207264. [DOI] [PubMed] [Google Scholar]
- 2.Alvarez-Lorenzo C, Bromberg L, Concheiro A. Light-sensitive intelligent drug delivery systems. Photochem Photobiol. 2009;85:848–860. doi: 10.1111/j.1751-1097.2008.00530.x. [DOI] [PubMed] [Google Scholar]
- 3.Elleri D, Dunger DB, Hovorka R. Closed-loop insulin delivery for treatment of type 1 diabetes. BMC Medicine. 2011;9 doi: 10.1186/1741-7015-9-120. [DOI] [PMC free article] [PubMed] [Google Scholar]
- 4.Langendam M, Luijf YM, Hooft L, Devries JH, Mudde AH, Scholten RJ. Continuous glucose monitoring systems for type 1 diabetes mellitus. Cochrane database of systematic reviews (Online) 2012;1 doi: 10.1002/14651858.CD008101.pub2. [DOI] [PMC free article] [PubMed] [Google Scholar]
- 5.Weinzimer SA. Closed-loop artificial pancreas: Current studies and promise for the future. Current Opinion in Endocrinology, Diabetes and Obesity. 2012;19:88–92. doi: 10.1097/MED.0b013e3283514e6b. [DOI] [PubMed] [Google Scholar]
- 6.Agard NJ, Prescher JA, Bertozzi CR. A strain-promoted [3 + 2] azide-alkyne cycloaddition for covalent modification of biomolecules in living systems. J Am Chem Soc. 2004;126:15046–15047. doi: 10.1021/ja044996f. [DOI] [PubMed] [Google Scholar]
- 7.Debets MF, van Berkel SS, Dommerholt J, Dirks AT, Rutjes FP, van Delft FL. Bioconjugation with strained alkenes and alkynes. Acc Chem Res. 2011;44:805–815. doi: 10.1021/ar200059z. [DOI] [PubMed] [Google Scholar]
- 8.Debets MF, van Berkel SS, Schoffelen S, Rutjes FP, van Hest JC, van Delft FL. Aza-dibenzocyclooctynes for fast and efficient enzyme PEGylation via copper-free (3+2) cycloaddition. Chem Commun (Camb) 2010;46:97–99. doi: 10.1039/b917797c. [DOI] [PubMed] [Google Scholar]
- 9.Benson BW. The Foundations of Chemical Kinetics. 1960. [Google Scholar]
- 10.Kloxin AM, Tibbitt MW, Anseth KS. Synthesis of photodegradable hydrogels as dynamically tunable cell culture platforms. Nat Protoc. 2010;5:1867–1887. doi: 10.1038/nprot.2010.139. [DOI] [PMC free article] [PubMed] [Google Scholar]
- 11.Lallana E, Fernandez-Trillo F, Sousa-Herves A, Riguera R, Fernandez-Megia E. Click chemistry with polymers, dendrimers, and hydrogels for drug delivery. Pharm Res. 2012;29:902–921. doi: 10.1007/s11095-012-0683-y. [DOI] [PubMed] [Google Scholar]
- 12.Sen Gupta S, Kuzelka J, Singh P, Lewis WG, Manchester M, Finn MG. Accelerated bioorthogonal conjugation: a practical method for the ligation of diverse functional molecules to a polyvalent virus scaffold. Bioconjug Chem. 2005;16:1572–1579. doi: 10.1021/bc050147l. [DOI] [PubMed] [Google Scholar]
- 13.Sugai N, Heguri H, Ohta K, Meng Q, Yamamoto T, Tezuka Y. Effective click construction of bridged- and spiro-multicyclic polymer topologies with tailored cyclic prepolymers (kyklo-telechelics) J Am Chem Soc. 2010;132:14790–14802. doi: 10.1021/ja103402c. [DOI] [PubMed] [Google Scholar]
- 14.Sumerlin BS, Vogt AP. Macromolecular Engineering through Click Chemistry and Other Efficient Transformations. Macromolecules. 2010;43:1–13. [Google Scholar]
- 15.Tasdelen MA, Kahveci MU, Yagci Y. Telechelic polymers by living and controlled/living polymerization methods. Prog Polym Sci. 2011;36:455–567. [Google Scholar]
- 16.Wong DY, Griffin DR, Reed J, Kasko AM. Photodegradable Hydrogels to Generate Positive and Negative Features over Multiple Length Scales. Macromolecules. 2010;43:2824–2831. [Google Scholar]
- 17.Zhao H, Sterner ES, Coughlin EB, Theato P. o-Nitrobenzyl Alcohol Derivatives: Opportunities in Polymer and Materials Science. Macromolecules. 2012;45:1723–1736. [Google Scholar]
- 18.Zhou H, Woo J, Cok AM, Wang M, Olsen BD, Johnson JA. Counting primary loops in polymer gels. Proc Natl Acad Sci U S A. 2012;109:19119–19124. doi: 10.1073/pnas.1213169109. [DOI] [PMC free article] [PubMed] [Google Scholar]
Associated Data
This section collects any data citations, data availability statements, or supplementary materials included in this article.


