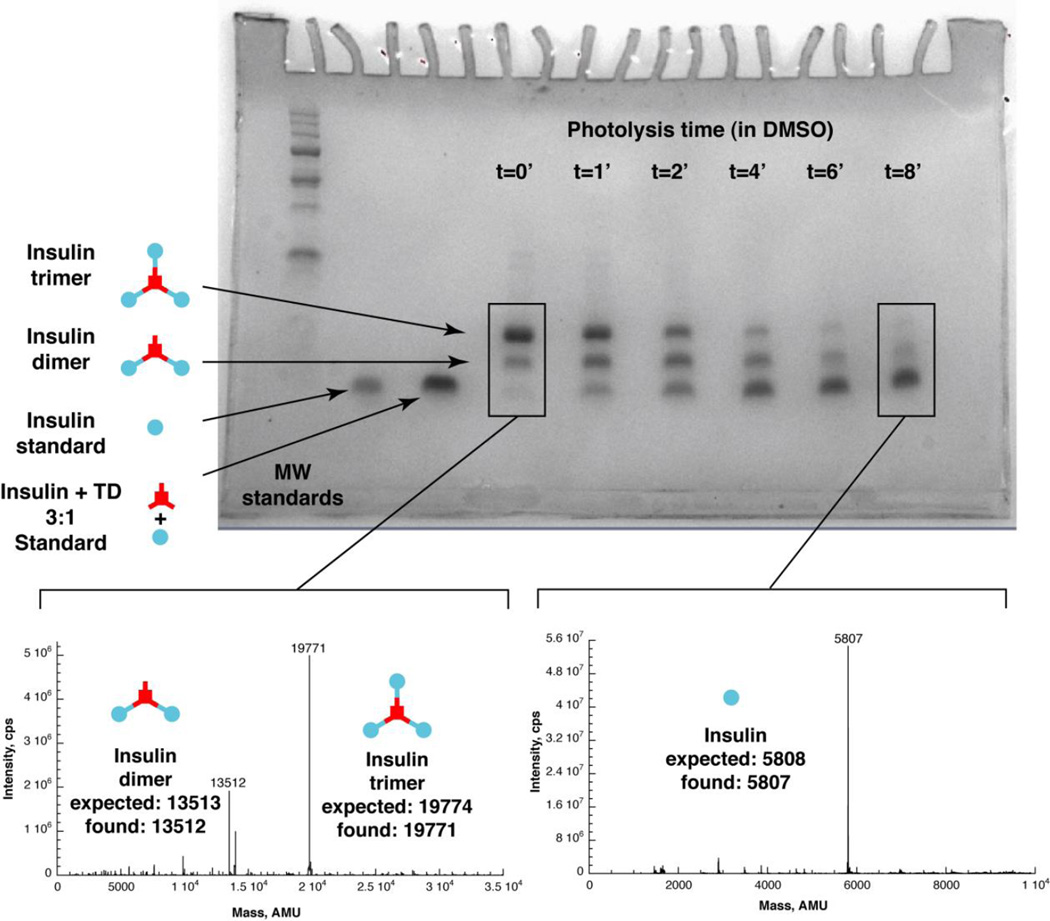
Figure 1. Gel analysis of insulin trimer and photolysis in DMSO.
Gel, Lane 1: molecular weight standards. Lane 2: standard insulin. Lane 3: standard 1:3 TD:insulin mixed. Lane 4: 1:3.3 TD:IMA product (“trimer”) at time 0. Lane 5–10: Trimer product irradiated for 1 min., 2 min., 4 min., 6 min., 8 min., by a fluorescent light source. Lower left mass spectrum: Deconvoluted ESI-MS of product of 1:3.3 TD: IMA reaction. Expected mass of trimer 19774, found 19771. Dimer also observed. Expected mass of dimer 13513, found 13512. Lower right mass spectrum: Mass spectrum of insulin trimer photolyis product in DMSO. Deconvoluted ESI-MS of sample from 8 minute time point. Insulin expected mass 5808, found 5807.

