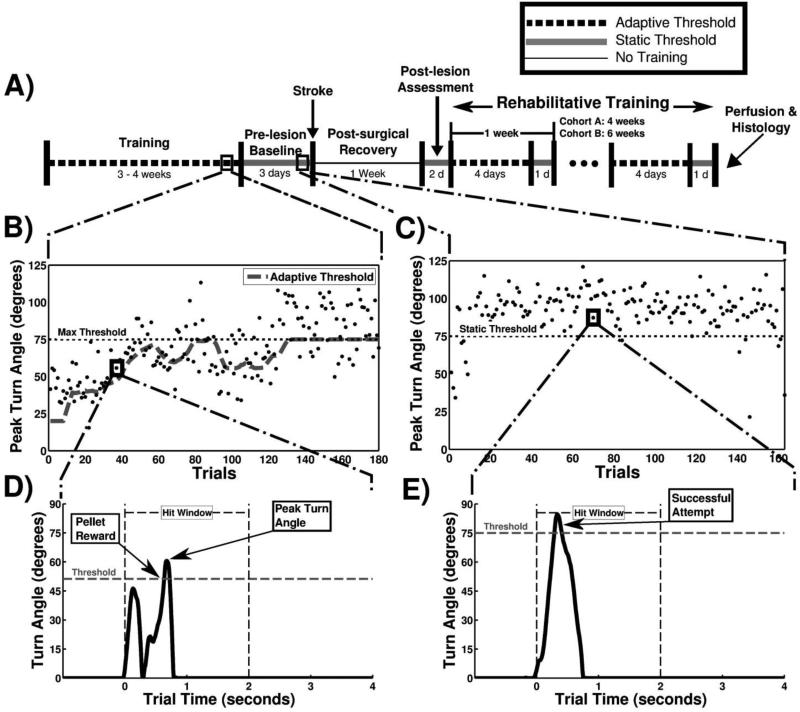
Figure 2.
Experimental timeline and behavioral training. (A) Timeline of experiment. Training was performed twice daily. One week represents 5 days of training or 10 behavioral sessions. (B) Peak turn angle of individual trials taken from one session during the adaptive training. Each point represents the peak turn angle of a single trial. The horizontal black dotted line at 75 degrees represents the maximum threshold for Cohort B, and the large gray dashed line indicates the adaptive threshold within one behavioral session. (C) Example session during static training with the horizontal black dotted line at 75 degrees indicating the static threshold. (D) A single, representative trial from a pre-lesion animal during an adaptive training session. The horizontal gray dashed line indicates the turn angle success threshold. The leftmost arrow indicates when a pellet reward is delivered once the turn angle crosses the success threshold, and the rightmost arrow shows the peak turn angle of the trial. (E) A single trial from a pre-lesion animal during a static training session, with the arrow indicating a successful trial attempt in which the turn angle exceeded the threshold.

