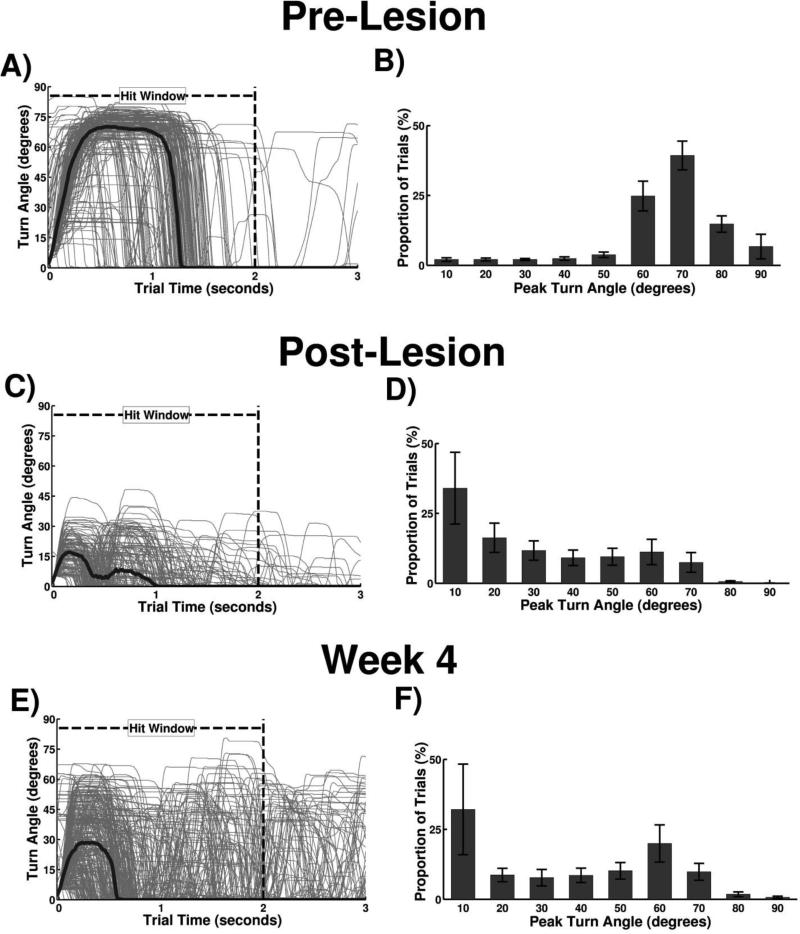
Figure 4.
Turn angle measurements from a single animal and group turn angle histograms. (A) Trial signals overlaid from one pre-lesion animal during a behavioral session. Gray lines represent individual trial signals, and thick black line indicates average turn angle at each sample. (B) Pre-lesion group histogram of peak turn angle from Cohort A. (C) Trial signals and average overlaid from one post-lesion behavioral session. (D) Post-lesion group histogram of peak turn angle from Cohort A. (E) Trial signals and average overlaid from one session during the fourth week of post-injury training. (F) Group histogram from the fourth week of post-injury training.

