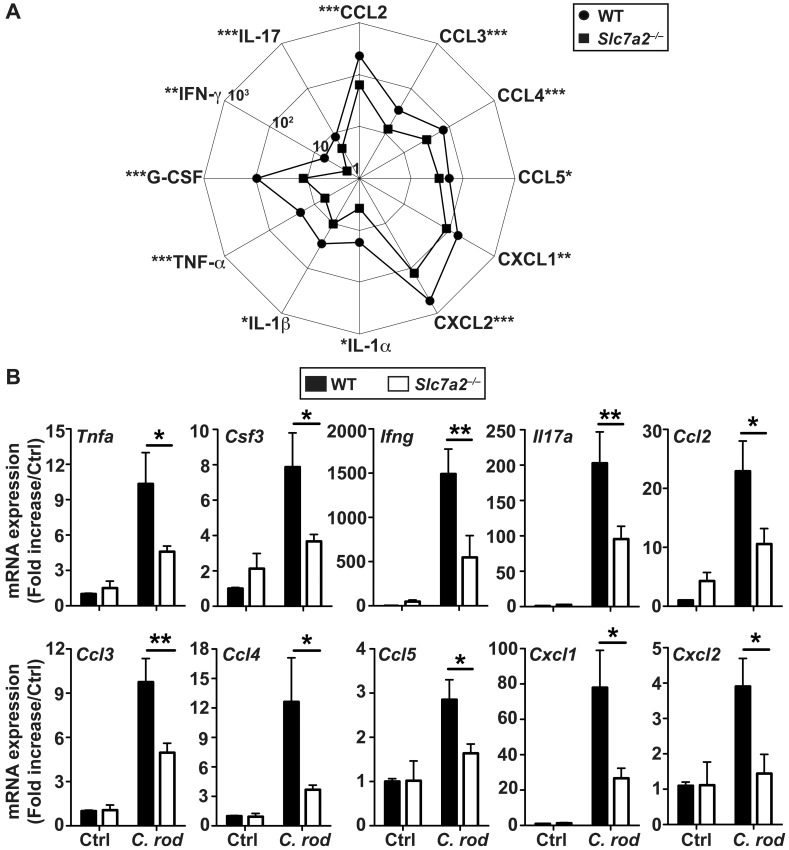
Fig 4. Immunoprofiling of WT and Slc7a2 –/–mice.
Animals were infected with C. rodentium (C. rod) or not (Ctrl) for 14 days. (A) The concentrations of the cytokines in colon lysates were determined by Luminex assay. The scale represents the concentrations of analytes in pg/mg protein in colon tissues. *P < 0.05, **P < 0.01, ***P < 0.001 denote significant differences between infected WT (n = 14) and Slc7a2 –/–mice (n = 14). (B) Analysis of mRNA expression in the colon tissues. *P < 0.05, **P < 0.01; n = 3–5 Ctrl and n = 12–14 infected mice for each genotype.

