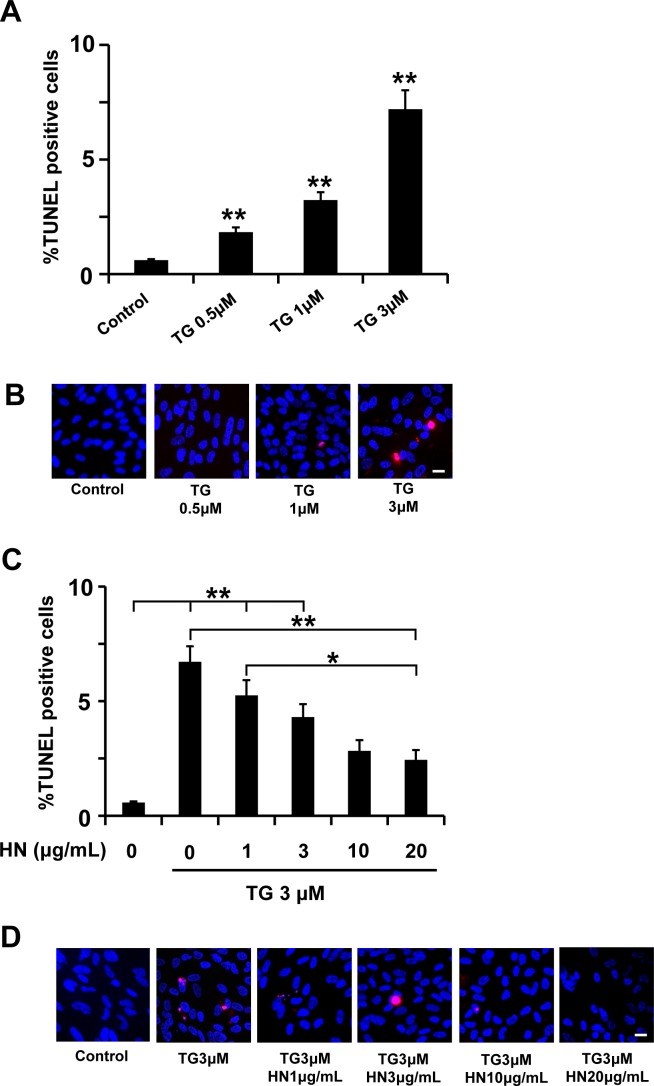
Fig 3. TG-induced apoptosis in RPE cells and protection by HN.
Confluent hRPE cells were treated with varying concentrations (0.5–3 μM) of TG for 12 hours. (A) Percentage of TUNEL positive cells increased in a dose-dependent manner with TG treatment. (B) Representative images of TUNEL positive cells (red) and nuclei (blue) are shown for each experimental condition. (C) Pre-incubation with HN for 12 hours protected RPE cells dose-dependently from apoptosis induced by TG (3 μM). (D) Representative images are shown for each HN treatment group. Data are mean ± SEM (n = 3). Asterisks represent **p<0.01). Scale bar: 20 μm in B and D.

