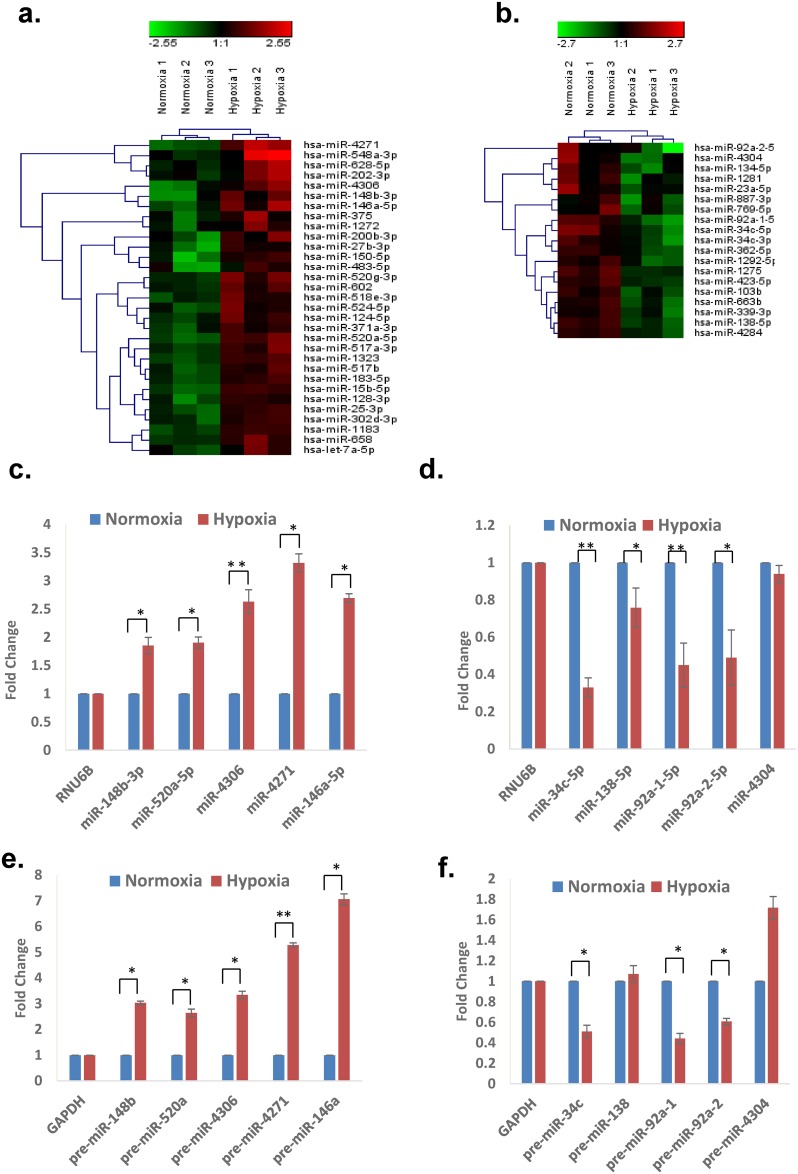
Fig 1. The miRNA signature of hypoxia in hESCs.
Hierarchical clustering of hypoxia (a) induced and (b) down-regulated miRNAs (> 2 fold, p<0.05) in response to hypoxia (2% O2) in SHEF1 hESC. Quantitative RT-PCR data of upregulated (c) mature miRNAs & (e) pre-miRNAs and downregulated (d) mature miRNAs & (f) pre-miRs of HRMs in SHEF1 cell line. Graphical data points in c, d, e and f represent mean ± S.D. of a minimum of three independent experiments. (*P>0.01 and <0.05, **P<0.01).

