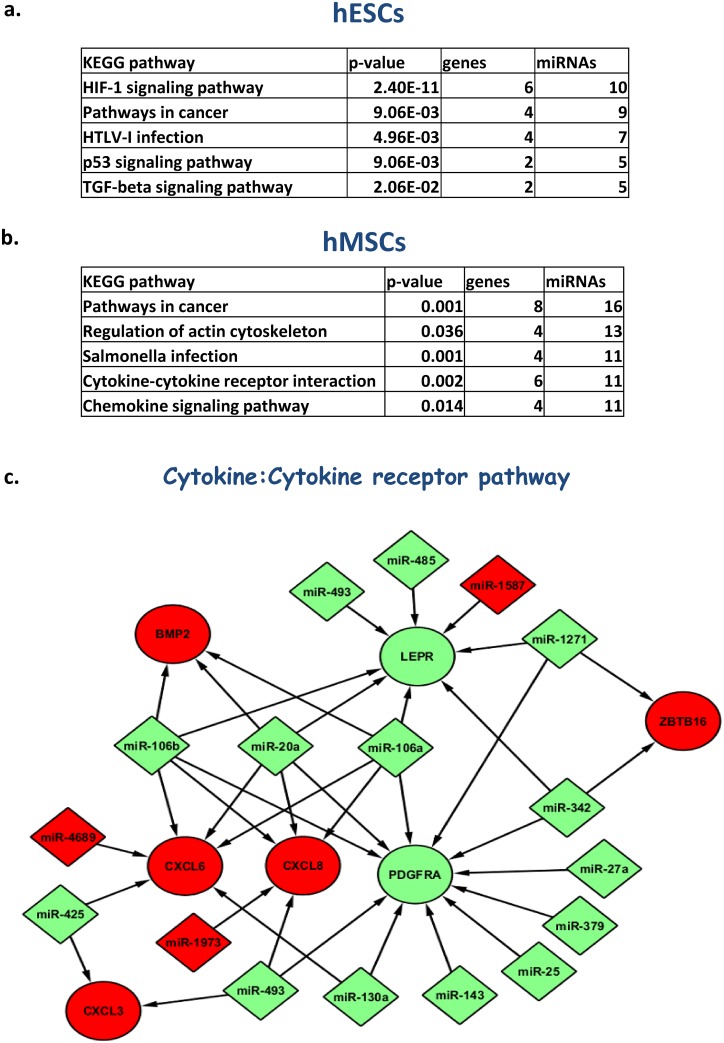
Fig 7. Pathway analysis of hypoxia regulated miRNAs.
Pathway association of up and down-regulated HRM in hESC and hMSCs, (a, b) respectively. A figure showing miRNA:target gene interaction network for cytokine:cytokine receptor pathway of MSCs drawn using Cytoscape software (c). The green colour indicates up-regulation whereas the red colour refers to down-regulation.

