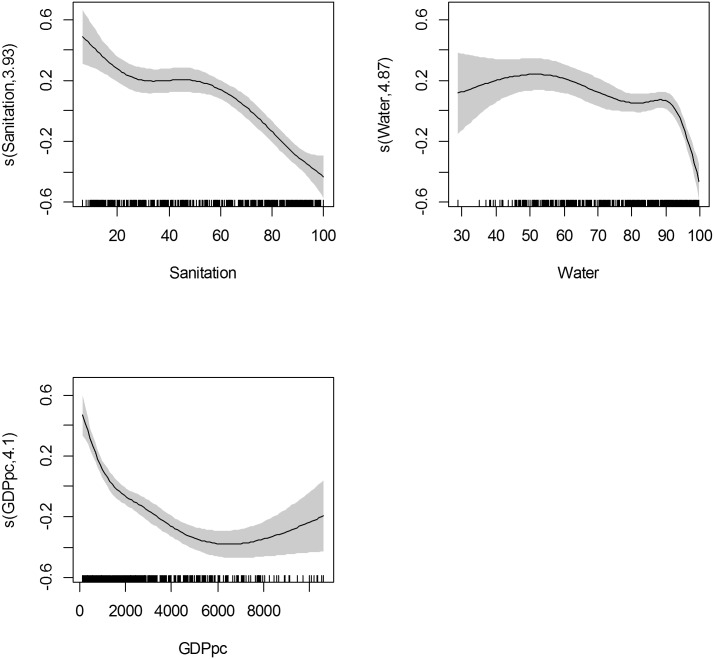
Fig 1. Partial residual plots showing impact on water and sanitation coverage at national level on log10 mortality from diarrhoeal disease in children aged 1 to 59 months olda.
aEach y axis shows the partial residual plot of the predictor with the relevant estimated degrees of freedom, with the partial residuals having a mean of zero. A decline of 1.0 along the y axis would equate to one log reduction in the outcome variable with the relevant change in the appropriate predictor assuming the other predictors remained constant. The grey shaded area represents the 95% confidence intervals. The small lines on the x axis represent the data points.

