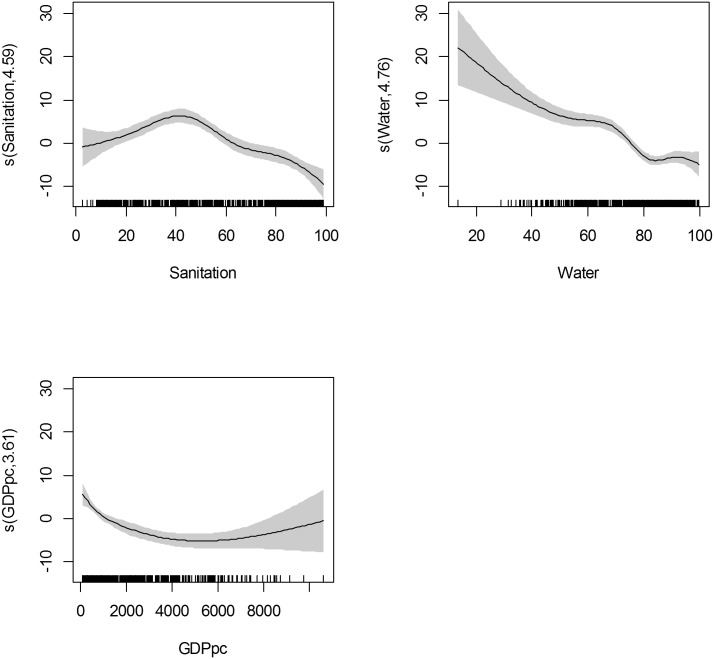
Fig 5. Partial residual plots showing impact on water and sanitation coverage at national level on percent of children under 5 years old underweighta,b.
aEach y axis shows the partial residual plot of the predictor with the relevant estimated degrees of freedom, with the partial residuals having a mean of zero. A decline of 10 along the y axis would equate to a 10% reduction in the outcome variable assuming the other predictors remained constant. The grey shaded area represents the 95% confidence intervals. The grey shaded area represents the 95% confidence intervals. The small lines on the x axis represent the data points. b underweight is proportion of children under 5 whose height for age is more than two standard deviations below the median for the international reference population ages 0–59 months.

