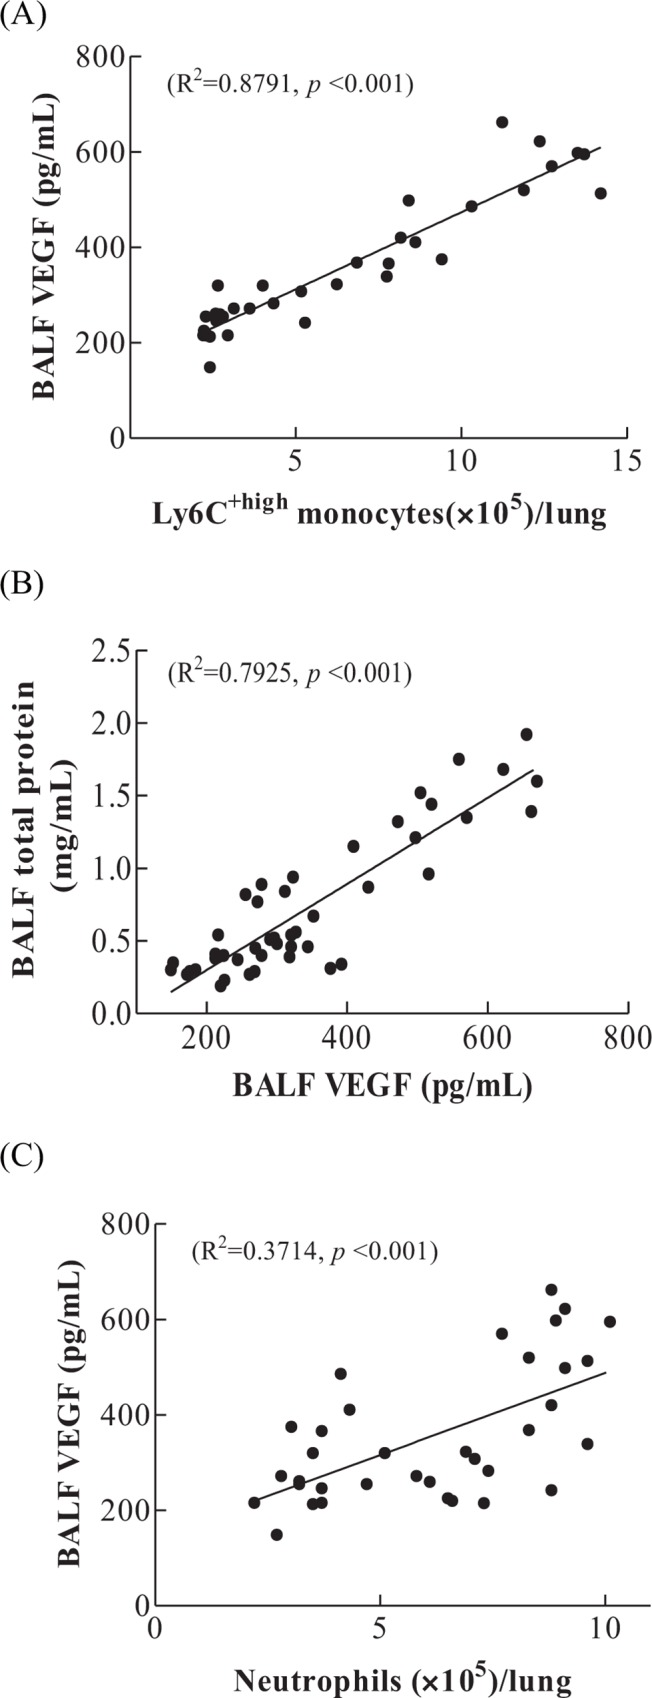
Fig 5.

Regression analysis (A) Correlation of Ly6C+high monocytes with BALF VEGF. Regression analysis, significant correlation between Ly6C+high monocytes and BALF VEGF (R2 = 0.8791, p<0.001). (B) Correlation between VEGF with total proteins. Regression analysis, significant correlation between VEGF and total proteins (R2 = 0.7925, p< 0.001). (C) Correlation of neutrophils with BALF VEGF. Regression analysis, R2 = 0.3714, p<0.001.
