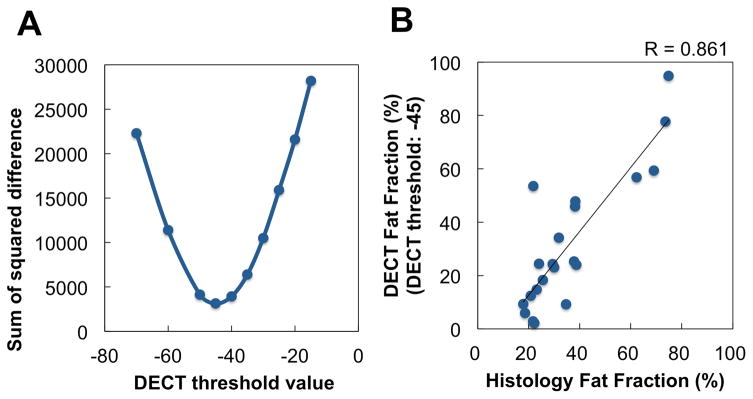
Figure 2.
Correlation between fat fractions obtained from dual-energy computed tomography and histology in cadaver data. (a) Relationship between DECT threshold and sum of squared difference of fat fractions obtained from histology and DECT. From this result, the threshold value for the separation of RM and YM was set −45. (b) Relationship between fat fraction of histology and DECT with the threshold value of −45.

