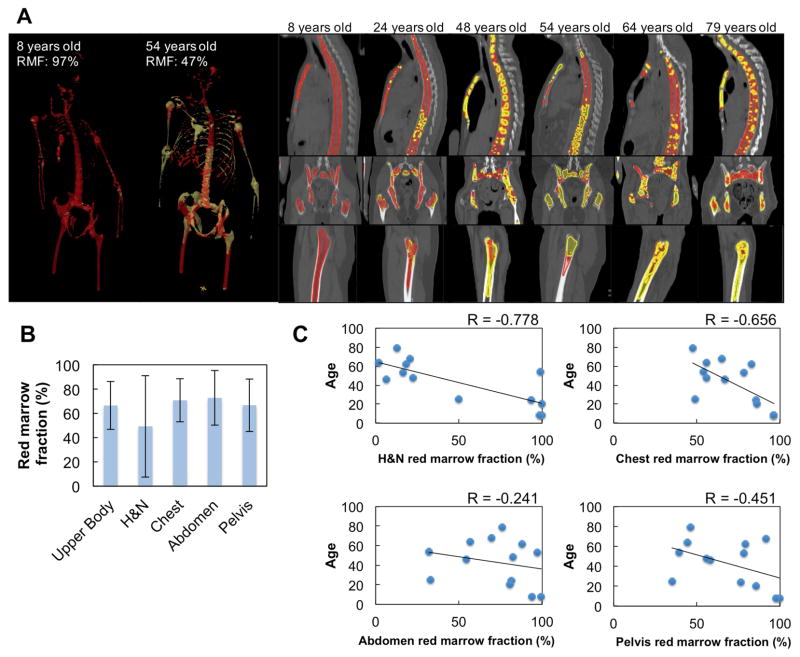
Figure 3.
Distribution of red marrow and marrow fat. (a) Representative marrow distribution of various patients and cadavers. Red regions show red marrow and yellow regions indicate yellow marrow. (b) Means and standard deviations of red marrow fractions in 13 cases. (c) relationship between red marrow fraction and age.

