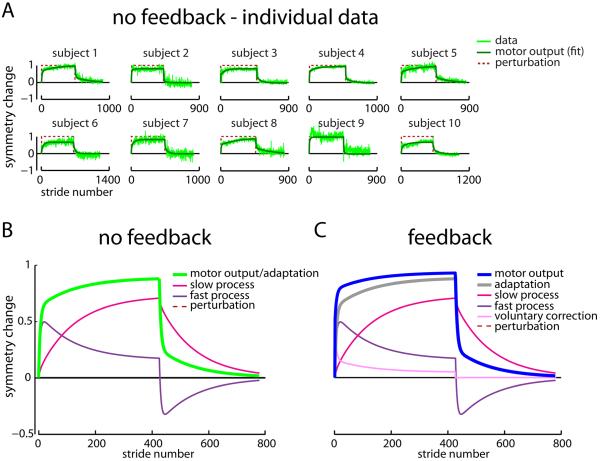
Figure 3.
Experiment 1 individual participant and group model fits. A) Dual-rate adaptation model fits are shown for Adaptation and Deadaptation symmetry change data from each participant in the No Feedback group. The data are shown in light green, the fit in dark green, and the perturbation (i.e., 1 for split belts, 0 for tied belts) in red. B) Dual-rate adaptation model fit to the group mean No Feedback data during Adaptation and Deadaptation. The motor output and adaptation (which overlap) are shown in green, slow process in magenta, fast process in purple, and perturbation in pink. C) Voluntary correction model fit to the Adaptation and Deadaptation group mean symmetry change data in the Feedback group. The motor output is shown in blue, adaptation in gray, slow process in magenta, fast process in purple, voluntary correction in pink, and perturbation in red. Note that the only difference between the fits on B and C is the presence of the voluntary correction process that also then changes the motor output. See also Figures S1 and S2.

