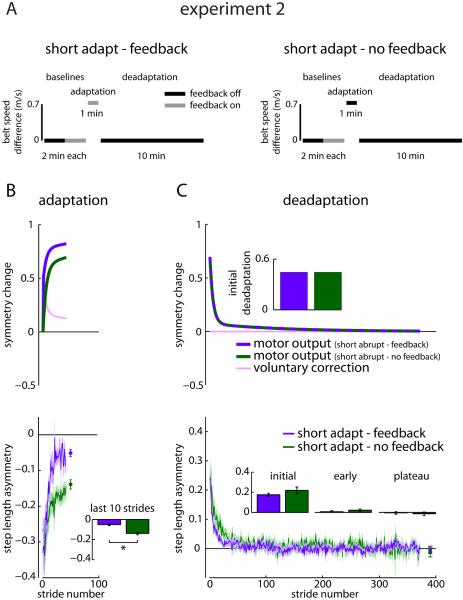
Figure 4.
Experiment 2 protocol and results. A) Experiment 2 protocols are shown for the Short Adapt-Feedback and Short Adapt-No Feedback groups. These protocols are identical to those tested in Experiment 1 except Adaptation is truncated to one minute. B) Adaptation predictions from the voluntary correction model based on parameters set in Experiment 1 (top) and mean ± SE adaptation curves across participants within the Short Adapt-Feedback (purple) and Short Adapt-No Feedback (dark green) groups (bottom) are shown. Data points immediately following the adaptation curves show the step length asymmetry (mean ± SE) of the last 10 strides of Adaptation for each group. * indicates a significant difference with p < 0.05. C) Deadaptation predictions from the voluntary correction model based on parameters set in Experiment 1 (top) and mean deadaptation curves across participants within the Short Adapt - Feedback (purple) and No Feedback (dark green) groups ± SE (bottom) are shown. See also Figures S3 and S4.

