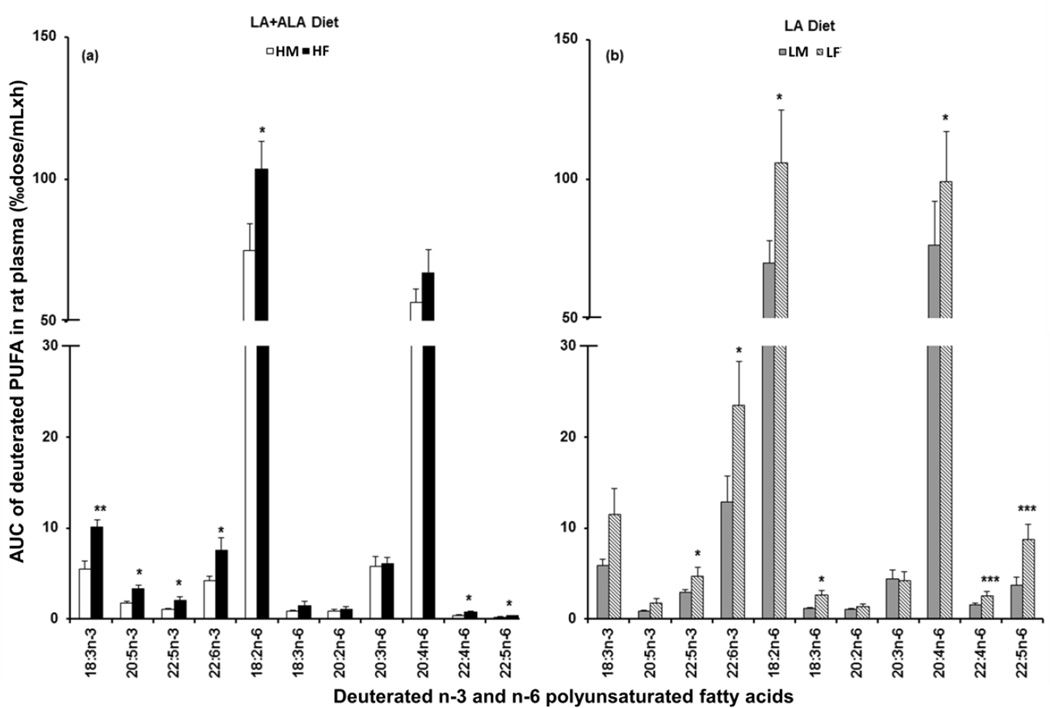
Figure 3.
Accumulations of the labeled n-3 and n-6 PUFA in rat plasma were presented as the area under the time-course curves over 0 to 168 h (AUC0→168, ‰dose/mL×h). The gender difference was compared in the LA+ALA diet (a) and in the LA diet (b). A two-sided, pairwise Student’s t test was applied to detect significant differences between genders within each diet (P < 0.05*, 0.01**, or 0.001***). See legend to Figure 1 for more details.

