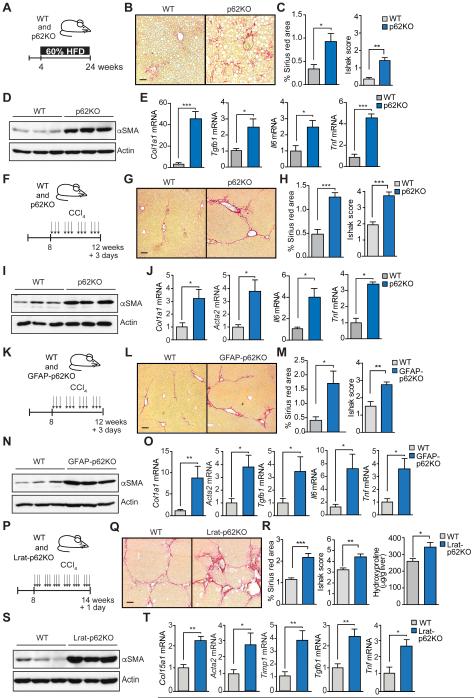
Figure 2. Selective p62 deficiency in hepatic stellate cells increases fibrosis upon liver injury.
(A) Schematic diagram of HFD protocol. Four week-old WT (n=5) and p62KO (n=5) mice were fed 60% fat diet during 20 weeks. (B) Sirius red staining of livers of WT and p62KO mice. (C) Sirius red positive area and Ishak score of WT and p62KO livers. (D) Immunoblot analysis of αSMA and Actin in WT and p62KO livers. (E) qPCR analysis of indicated mRNA. (F) Schematic diagram of CCl4-induced fibrosis protocol. Eight week-old mice were i.p. injected with 0.5 ml/kg body weight CCl4 (1:50 v/v in corn oil) three times per week during 4 weeks. Mice were sacrificed 3 days after the last injection (n=6, per genotype). (G) Sirius red staining of livers of WT and p62KO mice (n=6). (H) Sirius red positive area and Ishak score. (I) Immunoblot analysis of αSMA and Actin in WT and p62KO livers. (J) qPCR analysis of indicated mRNA in livers of mice described in (F). (K) Scheme of CCl4-induced fibrosis model as in (F) in WT (n=5) and GFAP-p62KO (n=9) mice. (L) Sirius red staining of livers of WT and GFAP-p62KO mice. (M) Sirius red positive area and Ishak score of WT and GFAP-p62KO livers. (N) Immunoblot analysis of αSMA and Actin in WT and GFAP-p62KO livers. (O) qPCR analysis of indicated mRNA in livers from the mice described in (K). (P) Scheme of CCl4-induced fibrosis protocol. Eight week-old WT (n=6) and Lrat-p62KO (n=5) mice were i.p. injected with 0.5 ml/kg body weight CCl4 (1:10 v/v in corn oil) three times per week during 6 weeks. Mice were sacrificed 1 day after the last injection. (Q) Sirius red staining of livers of WT and Lrat-p62KO mice. (R) Sirius red positive area, Ishak score, and hydroxyproline content of livers of WT and Lrat-p62KO mice. (S) Immunoblot analysis of αSMA and Actin in WT and Lrat-p62KO livers. (T) qPCR analysis of indicated mRNA of livers from the mice described in (P). Scale bars, 100 μm. Results are presented as mean ± SEM. *p<0.05, **p<0.01, ***p<0.001. See also Figure S2.

