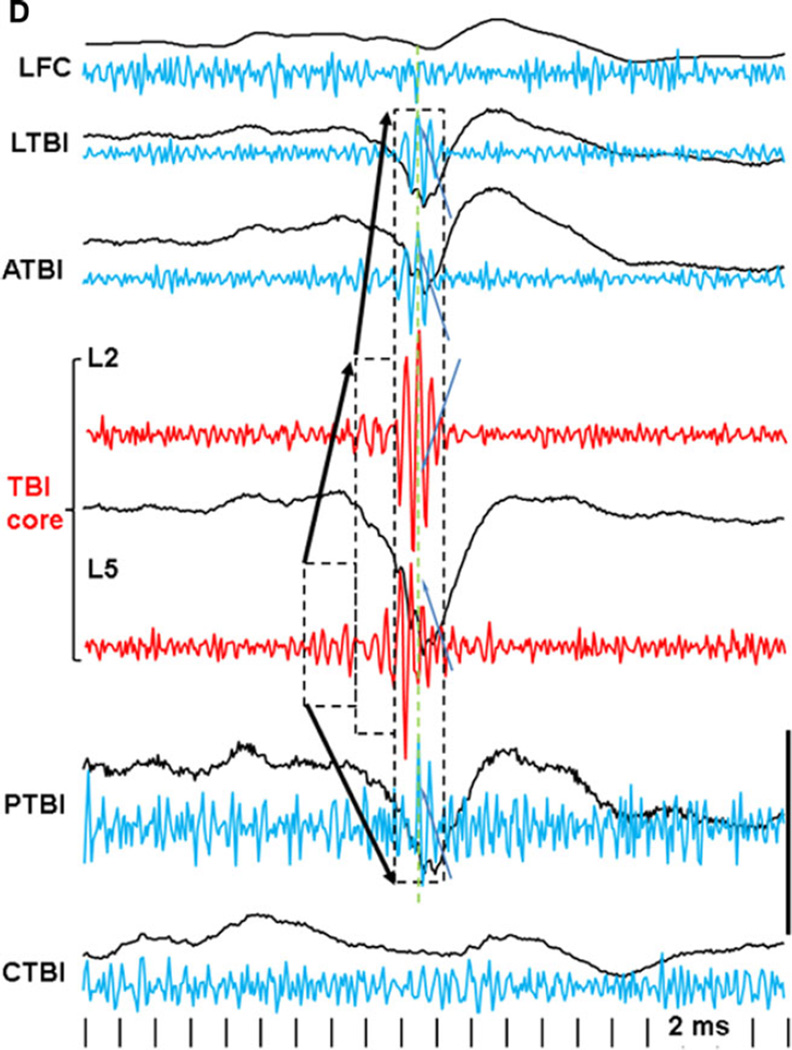
Figure 3.
An example of pHFO propagation in rat TBI-4. The pHFO is generated in the TBI area and propagates to adjacent areas but not distant areas. Dashed boxes outline the channels involved in the generation of pHFO. Black lines are raw data recorded within a frequency band 0.1 Hz–10 kHz, blue and red: band pass filtered at 100–600 Hz. Calibration scale is 0.5 mV for raw records, 0.1 mV for band pass filtered. Dashed boxes outline the number of recording sites where pHFOs were detected. Arrows indicate propagation of pHFOs. LFC, left frontal cortex; LTBI, neocortex lateral to the TBI core; ATBI, neocortex anterior to the TBI core; TBI, TBI core; PTBI, neocortex posterior to the TBI core; CTBI, neocortex in the homotopical point in the contralateral hemisphere.
Epilepsia © ILAE

